Download presentation
Presentation is loading. Please wait.

1
Suzanne Childress Erik Sabina Robert Spotts Denver Regional Council of Governments Transportation Planning Applications Conference Reno May 2011

2
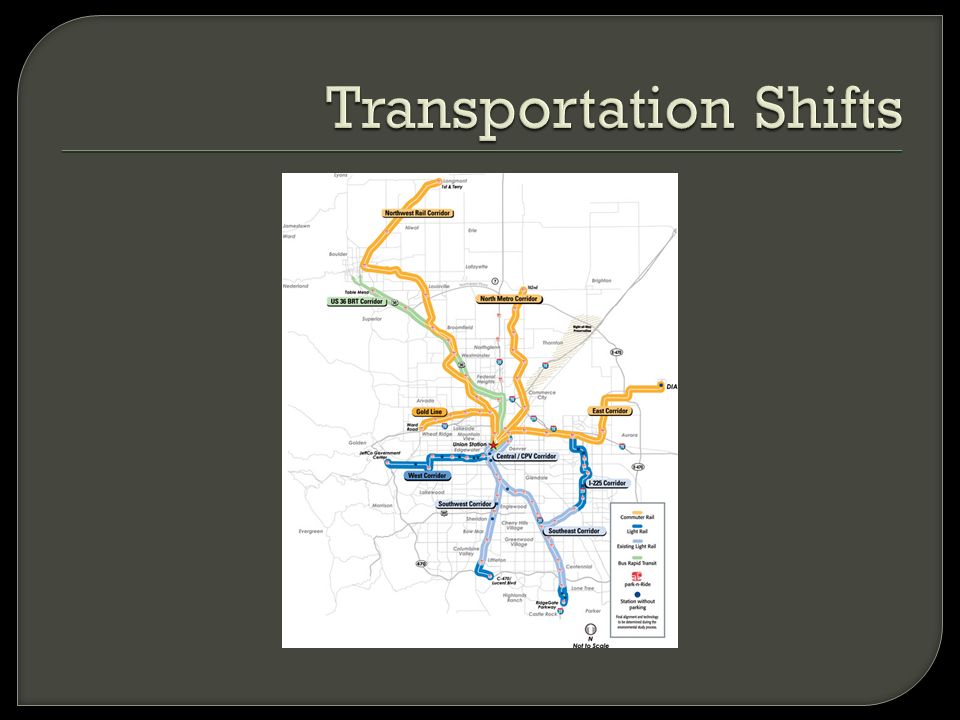
2010 Pop 2.9m Emp 1.6m 2035 Pop 4.5m Emp 2.6m Planning Goals Urban Centers Urban Growth Boundary New regional light rail Transit Oriented Development

3
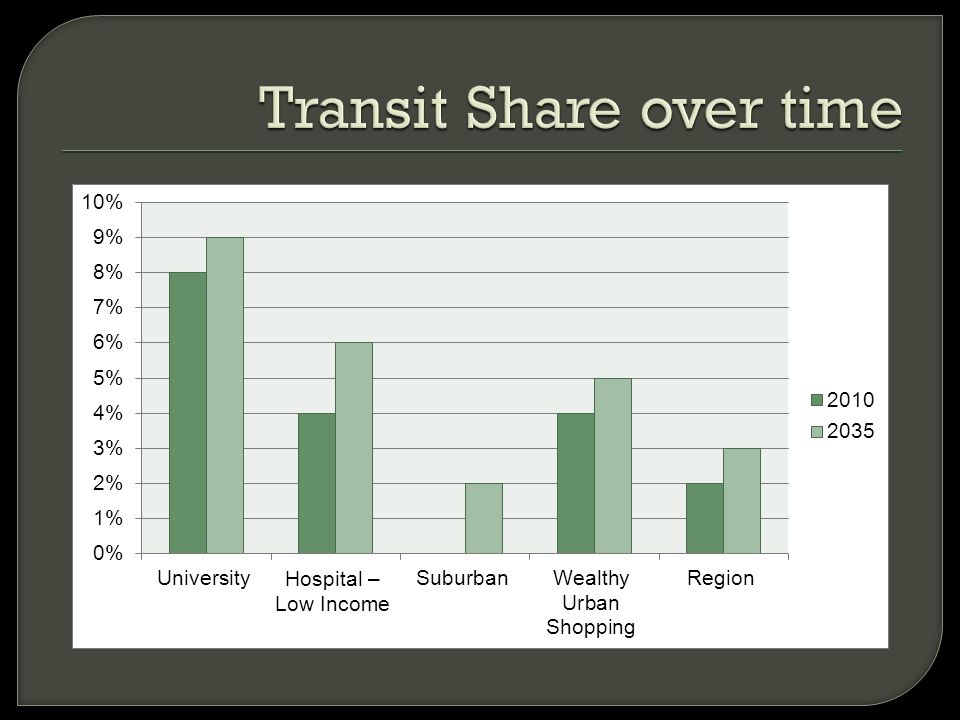
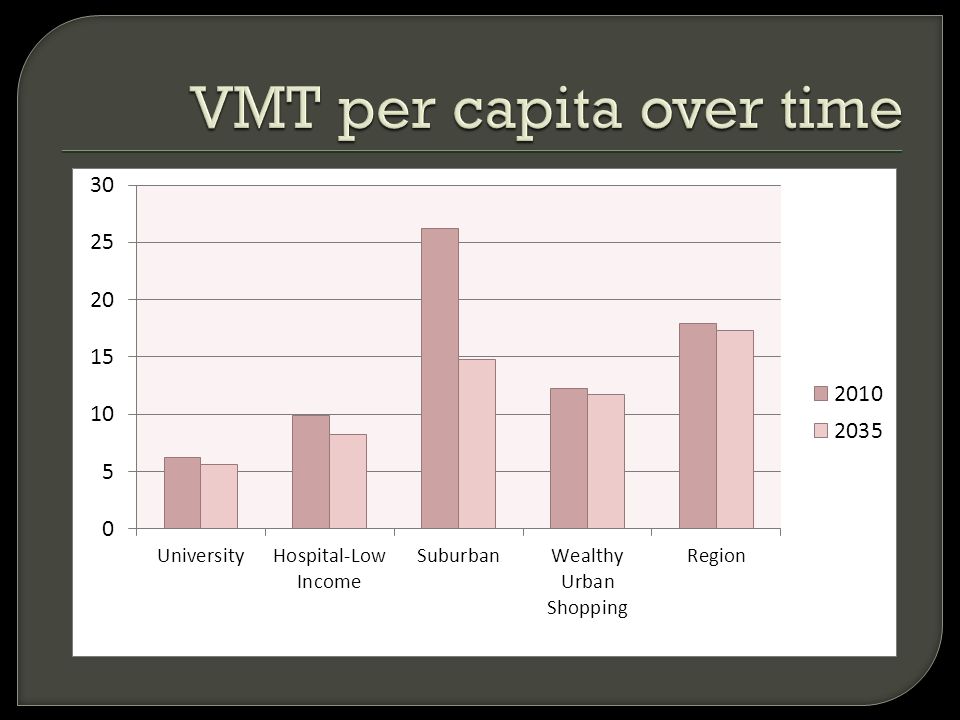
Long-term planning goals 2010 to 2035 10% VMT per capita reduction 10% single occupancy vehicle mode share reduction 50% of new housing/75% of new jobs in urban center s Transportation Improvement Program (TIP) Fund Allocation -Planning Funds for Transit-Oriented Developments And Urban Centers -Bicycle-Pedestrian Project Funds
 Fund Allocation -Planning Funds for Transit-Oriented Developments And Urban Centers -Bicycle-Pedestrian Project Funds")
4
Disaggregation allows for greater control and summarization (can slice and dice) More variables = more sensitivity Tracking households and people with unique characteristics
 More variables = more sensitivity Tracking households and people with unique characteristics")
5
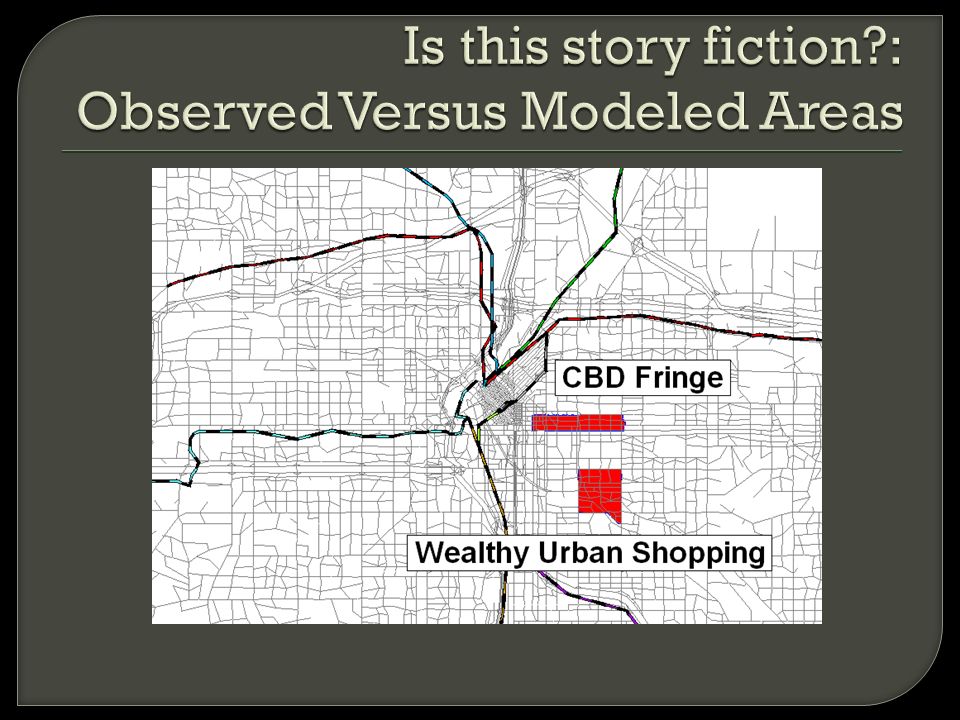
In what ways is Denver’s activity-based model useful at depicting travel behavior on a small geography? In what ways is it not useful?

6
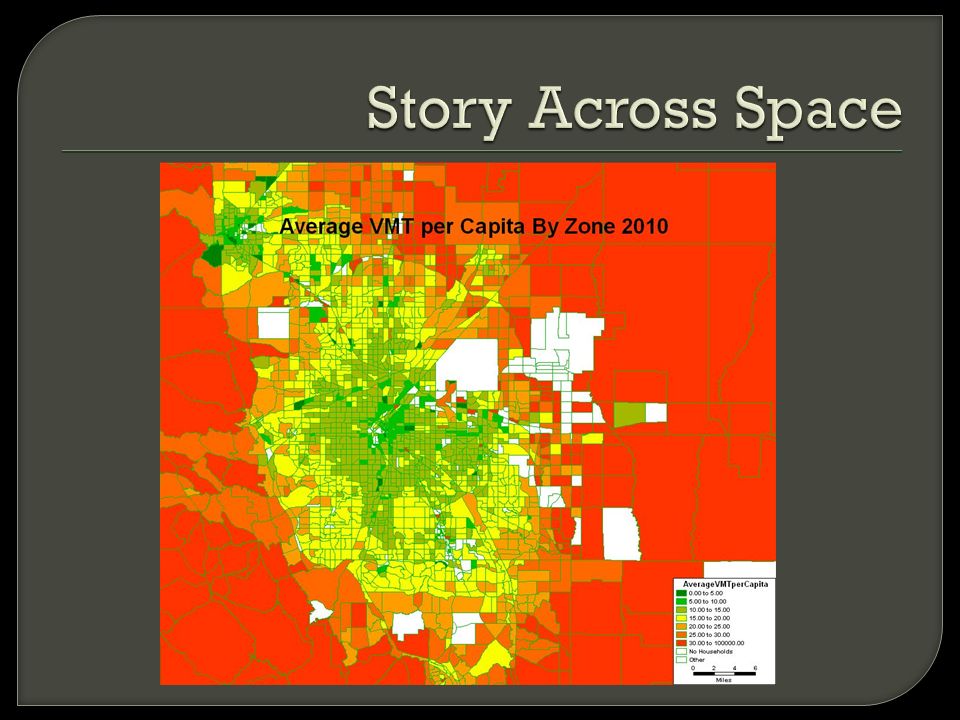
The input variables cause outputs consistent with research and logic. Match reality in the base year (makes for a believable story) Tell a story across time, space, and types of people.
 Tell a story across time, space, and types of people..")
9
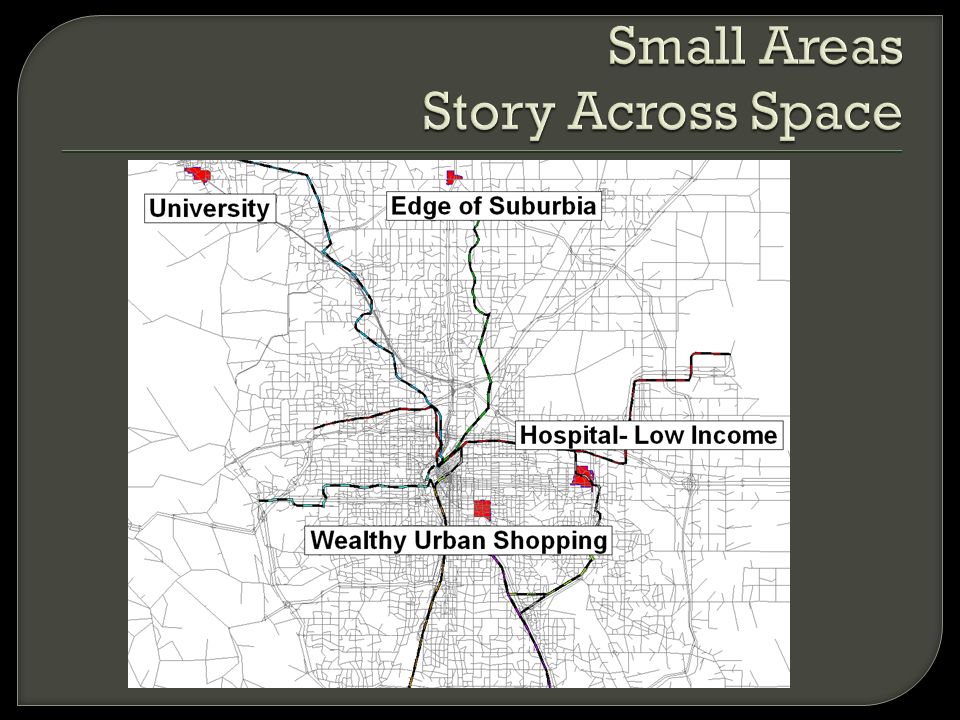
Description Average Household Income (2000$) Average Household Children University $ 23,0000.1 Hospital – Low Income $ 33,0000.8 Edge of Suburbia $ 69,0000.6 Wealthy Urban Shopping $ 89,0000.2 Denver Region $ 69,0000.6
 Average Household Children University $ 23, Hospital – Low Income $ 33, Edge of Suburbia $ 69, Wealthy Urban Shopping $ 89, Denver Region $ 69,0000.6")
11
Description Share of 0 car Households Share of 3 + Car Households University30%12% Hospital - Low Income18%16% Edge of Suburbia0%28% Wealthy Urban Shopping16% Denver Region8%24%

15
1104 Observed Trips For Households in the Area

16
832 Observed Trips For Households in the Area

18
Description% Change in Population% Change in Employment University55%8% Hospital - Low Income59%188% Edge of Suburbia675%N/A Wealthy Urban Shopping34%8% Denver Region55%67%

22
Points out areas of weakness in the model Tells a story across time, space, and types of people. Guides planners and decision-makers Observed and modeled results in the same ballpark

23
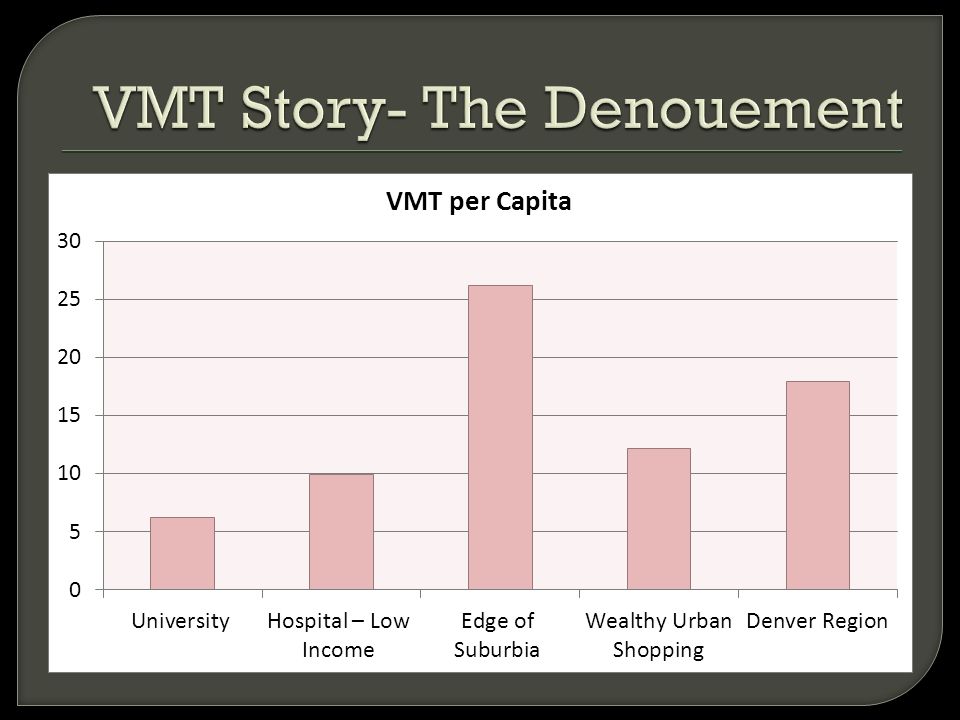
Current VMT per Capita Multi-modal potential- Reduction in single occupancy vehicle percentage (2035-2010)
")
24
User Base- Trips X-Y origins and destinations in 1.5 mile buffer Cost Effectiveness- Cost per Person Mile Traveled

Similar presentations