Download presentation
Presentation is loading. Please wait.

1
Emir Ibrahimovic Chelsea Behrens Caleb Pols Mark Blazo

2
Company Background Leading provider of diversified general contracting, design and build, and self-perform construction services Comprised of for different parts: Building Group, Civil Group, Specialty Contractors Group, and Management Services Casinos, Hotels, Resorts, Hospitals, Educational Facilities, Highways, Bridges, etc. Operating history of 115 years Approximately 8,000 employees around the world

4
Growth The businesses are integrated with resources shared across business units They have structured a balanced business between Civil and Building operating capabilities Geographic footprint expanded through acquisitions Significant new contract opportunities exist in their core markets US infrastructure rehabilitation need Military buildup and relocation to Guam Reconstruction activities in Afghanistan & Haiti

5
SWOT Analysis Strengths – Civil Segment Backlog Acquisitions Competitive Advantage Weaknesses – Unrealized Revenue International Building Segment is still majority of revenue 83% in 2009, 70% in 2010, and 49% in 2011

6
SWOT Analysis Opportunities – American Jobs Act U.S. Military Threats – Current Economic Conditions Budget Shortfalls

7
Current Activities Recession Two years of projects in pipeline. Any additional projects will help increase profit margins. Recently added a $94 million project to repair part of the Washington Monument. In the processes of building new corporate facilities for Amazon.com, Facebook, and Apple Apple intends to build a corporate campus in Cupertino, California, which will be approximately 2.8 million square feet.

8
Quarter 3 Results Revenue of $1.10 billion compared to $1.17 billion in Q3 2011 Net income of $42.6 million (adjusted net income of $25.8 million) compared to $35.5 million in Q3 2011 Diluted EPS of $0.88 (adjusted diluted EPS of $0.54) compared to $0.74 in Q3 2011 Affirming FY2012 guidance: Revenue of $4.0 billion to $4.5 billion; Diluted EPS of $1.50 to $1.70, excluding discrete items
 compared to $35.5 million in Q Diluted EPS of $0.88 (adjusted diluted EPS of $0.54) compared to $0.74 in Q Affirming FY2012 guidance: Revenue of $4.0 billion to $4.5 billion; Diluted EPS of $1.50 to $1.70, excluding discrete items")
11
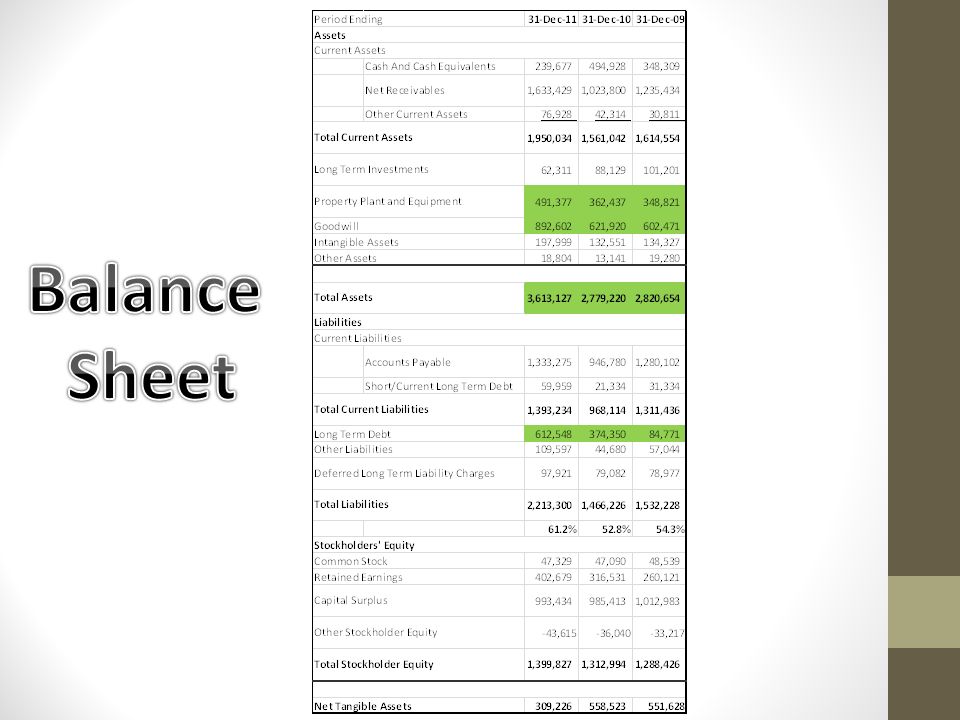
Ratio Analysis Ratio201020112012Industry Current Ratio1.21.61.41.3 GPM %7.5%10.6% 9.7% Long Term Debt % 3%13.5%17%12% Operating Exp3.4%5.2%6.1%6.5%

12
As of October 30, 2012 the average S&P 500 P/E ratio is 15.95. As of March 31, 2012 the TPC P/E ratio is 9.558

13
Technical Analysis

14
Yahoo Analysts - $18.00 MarketWatch Analyst - $18.67

15
Risks Diversification Where are their revenues coming from? 39% Private 7% Federal Government 54% State & Local Government 1 year price per share history 2011 $14.53 2012 $10.28 Debt $690.34 Million Profit Margin -6.04%

16
Proposal 150 shares @ $10.21 = $1,531.50 Long term holding for IPO: 3-5 years

17
Questions?

Similar presentations


 Analysts: Chris Landqvist, Justin Pippitt, Kelli Coldiron & Wei Pi.>")
>")


 - Extremely high barriers.>")

 Strengths: 1.Strong brand recognition, recall, and equity 2.Good cash reserves ($3,670,000,000)>")


 A. Firm Situation 1. General macro environment 2. Industry and Competitive analysis >")


 Aditya Chaudhry, Sooraj Achar.>")


