Download presentation
Presentation is loading. Please wait.

1
Systematic Center-to-limb Variations in Time-Distance Measurements and Meridional Flows Junwei Zhao & collaborators

2
When using time-distance pipeline to calculate derive meridional flows, we found that different observables gave sharply different results. ( Data presented in the following slides were from mid-December when solar B-angle is close to 0. )
.")
3
North-South Travel Times as A Function of Latitude

8
We felt very disheartened for quite some time, not sure how to explain this, until we found the following.

9
East-West Travel Times as A Function of Longitude

14
We still did not know how to explain the observed phenomena, but were happy to see the following results.

15
North-South Travel Times Subtract East-West Travel Times

20
So, it seems that although we do not understand the cause(s) of this systematic center-to-limb variations, it is quite possible that we can remove this effect by subtracting the longitude-dependent east-west measurement or inverted results. The following example further demonstrates this indeed works.

21
Meridional Flow Correction

22
Hopefully, I have already demonstrated that removing equatorial east-west measurements from the central north-south measurements is an acceptable and useful practice. Then, we wish to apply this approach to the deeper interior measurements in the hope of finding returning meridional flows.

23
Deeper Interior Measurements from Deep-Focus Time-Distance

24
Deep Measurements To better derive the deeper meridional flows, we used 14 months HMI observations, from May 2010 till July 2011. To better remove the systematic effect we talked about, we limit our calculations to the central meridian and equatorial areas with width of 20 degrees. We cross-correlate signals in two small arcs, very similar to Giles (1999), but slightly different. We did not use any filtering in the procedure, but used running-difference data for analysis. Our calculations reach up to 320 Mm in depth.
, but slightly different. We did not use any filtering in the procedure, but used running-difference data for analysis. Our calculations reach up to 320 Mm in depth..")
25
Deep Measurements: τ ns in Central Meridian and τ we along Equatorial Areas

26
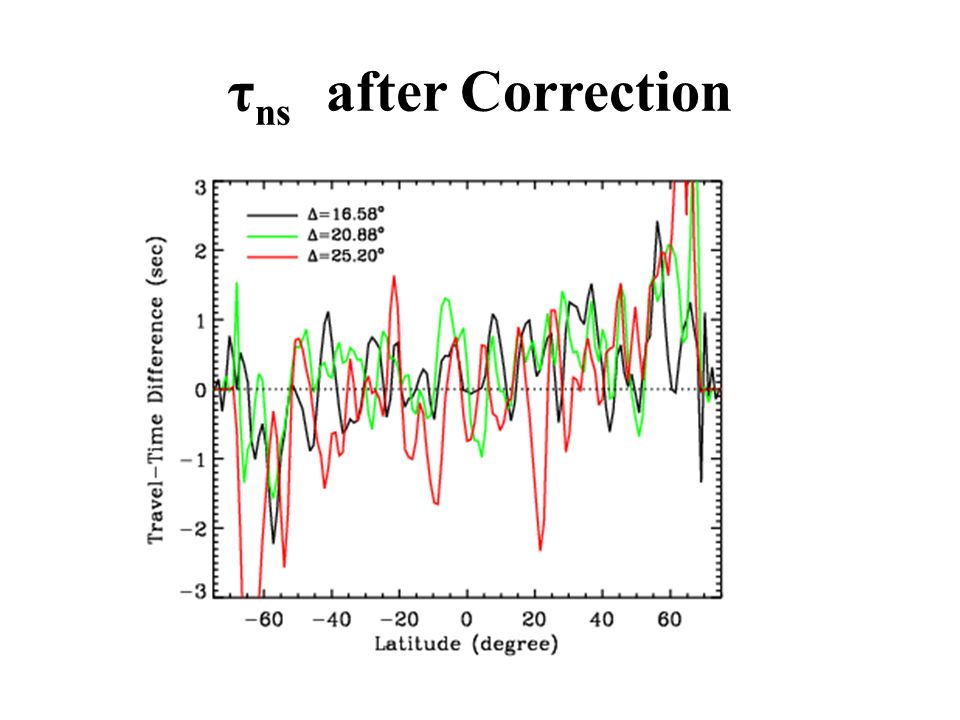
τ ns after Correction

28
Interior Rotation from Time-Distance Deep Measurements Solid lines are for northern hemisphere, and dashed lines are for southern hemisphere. No inversions have been done yet. Seems areas lower than 30 are quite similar to the global helioseismology results, and areas above have larger gradient than those results.

29
It is very promising that time-distance deep interior analysis on HMI data will give us some exciting results. Conclusion

30
Comparing time-distance pipeline flow field with DAVE4VM photospheric flow field

31
Flows in the AR11084 at 04:00 July 2 2010 on the photosphere from DAVE4VM (left) and at -0.5 Mm from time-distance (right).
 and at -0.5 Mm from time-distance (right).")
32
Flow of AR11158 at 18:00 UT Feb. 14 2011 from DAVE4VM (top) and Time-Distance (bottom). Shear motionSpinning

33
AR11158 at 18:00 Feb. 14 2011.

Similar presentations


 Tom Duvall Shravan Hanasoge “ASH team”>")
 David Benson,>")


>")


. Outline Some background Time-distance helioseismology: Solar-cycle variations of large-scale flows Near.>")


: Abbett/Hoeksema/Komm.>")
