Download presentation
Presentation is loading. Please wait.

1
Dairy Marketing Dr. Roger Ginder Econ 338 Fall 2009 Lecture # 8

2
U.S. Per Capita Consumption of Fluid Milk & Cream Source: Agricultural Statistics, NASS, USDA

3
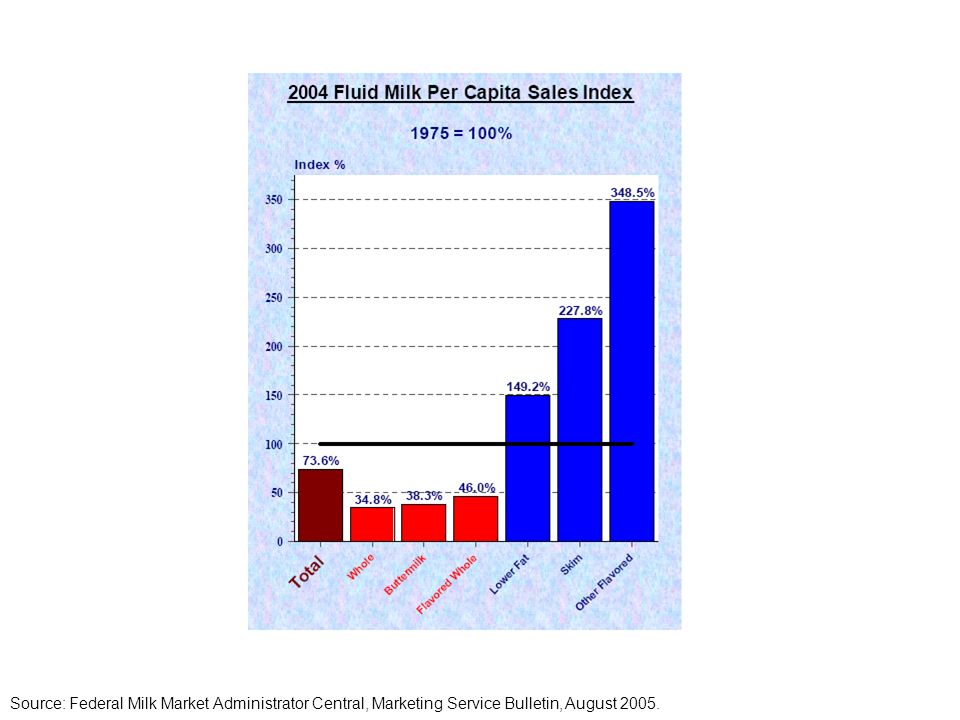
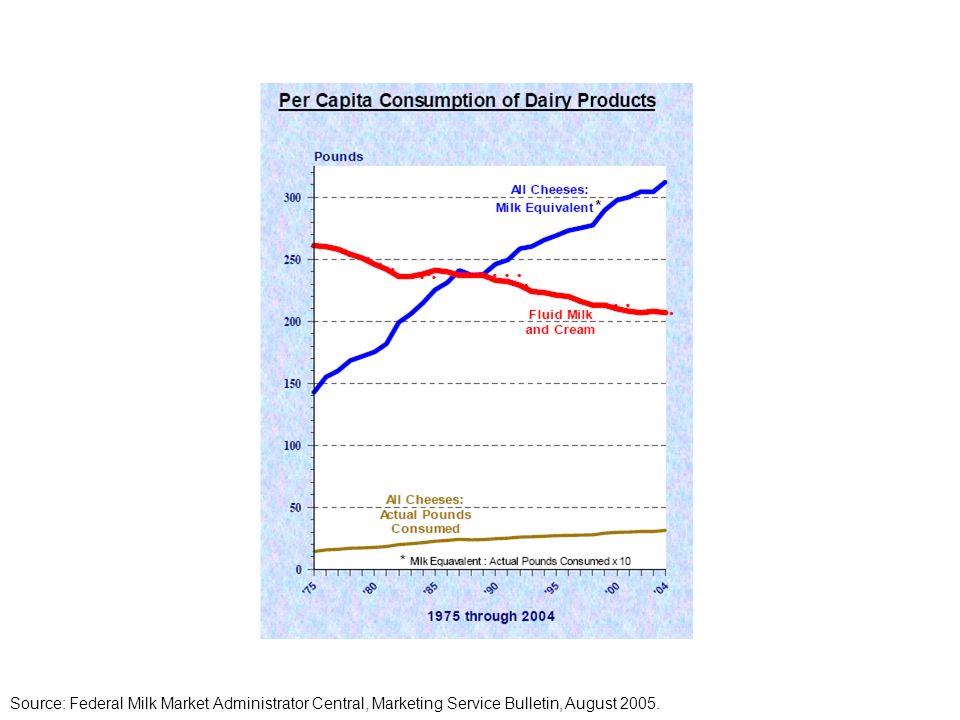
Source: Federal Milk Market Administrator Central, Marketing Service Bulletin, August 2005.

7
All Cheese Per Capita Consumption Source: Livestock, Dairy and Poultry Outlook, ERS, USDA, July, 2003

8
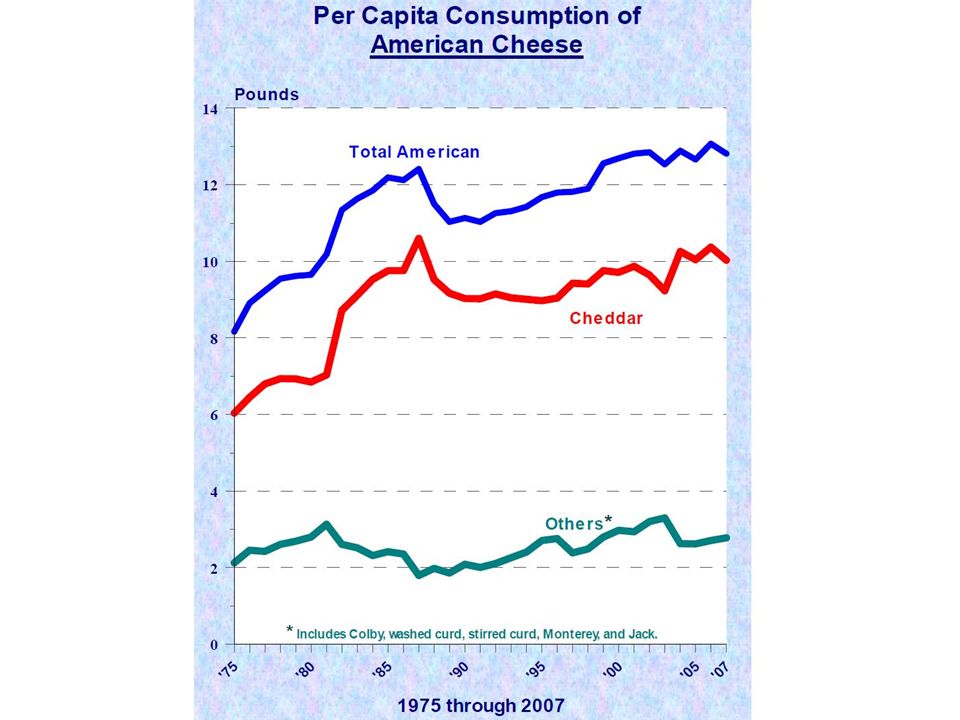
American Type Cheese Per Capita Consumption Source: Livestock, Dairy and Poultry Outlook, ERS, USDA, May, 2003

9
Italian Type Cheese Per Capita Consumption Source: Livestock, Dairy and Poultry Outlook, ERS, USDA, July, 2003

10
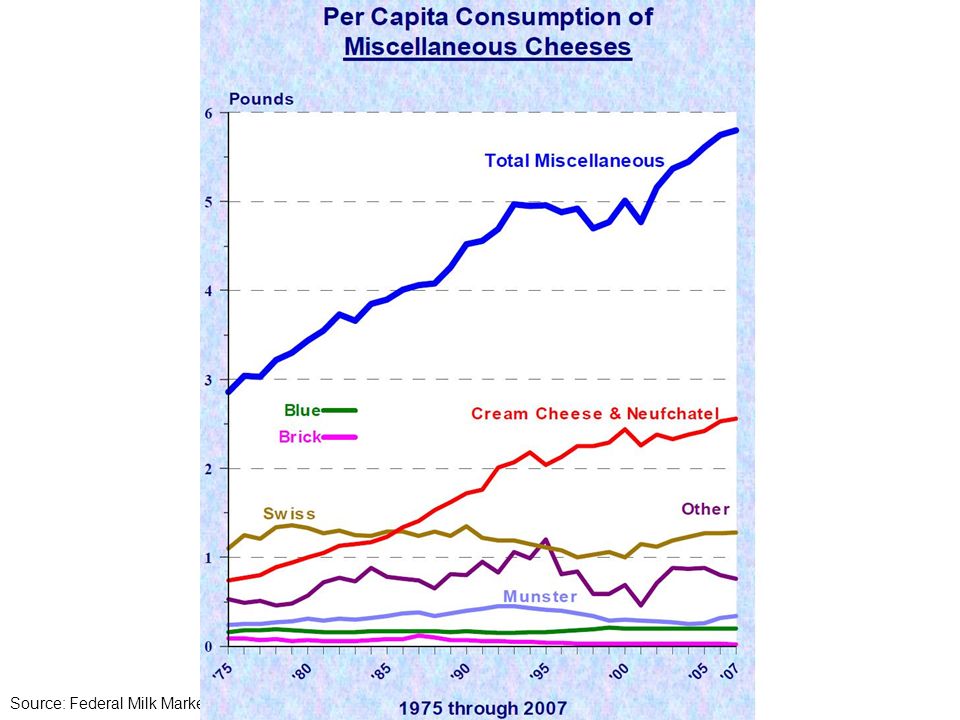
Per Capita Cheese Consumption

11
Source: Livestock, Dairy & Poultry Outlook, ERS, USDA, 2008.

14
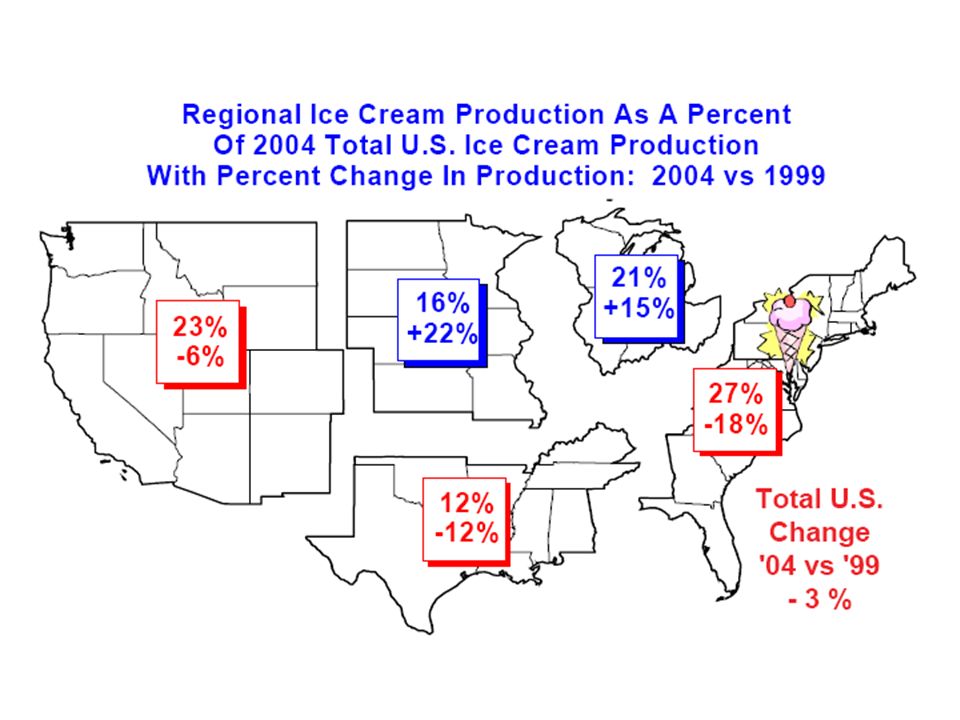
Source: Federal Milk Market Administrator Central, Marketing Service Bulletin, August 2005.

16
USDA, Federal Milk Marketing Administrator, Tulsa, 6/2005

18
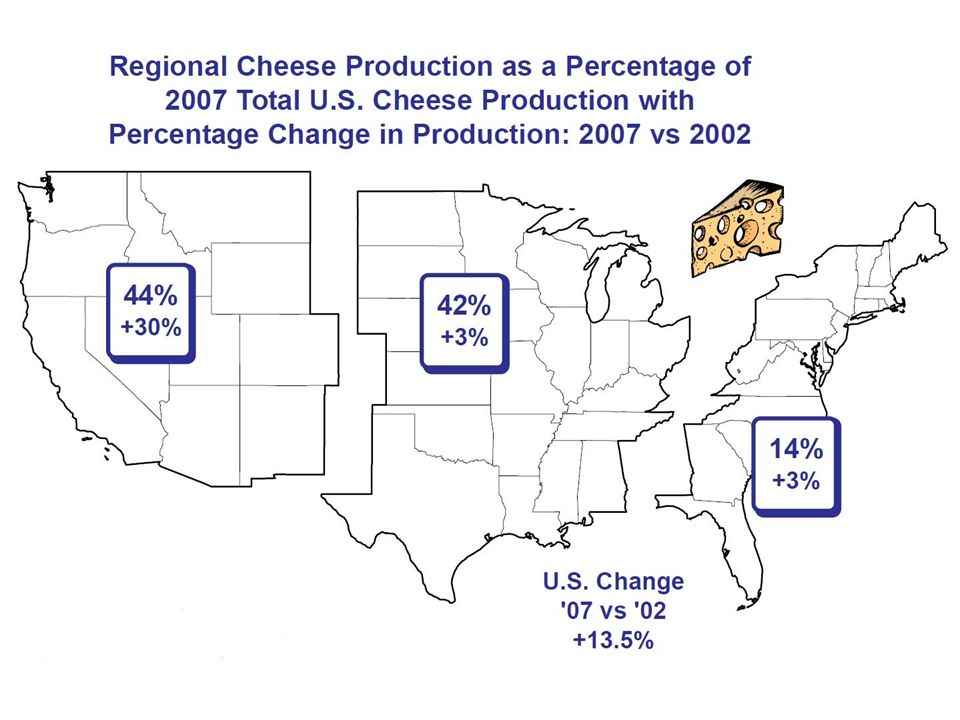
Regional Cheese Production as a Percent of Total U.S. Production Source: Federal Milk Market Administrator, Tulsa, April, 2004

19
U.S. Per Capita Consumption of Selected Dairy Products Source: Agricultural Statistics, NASS, USDA

21
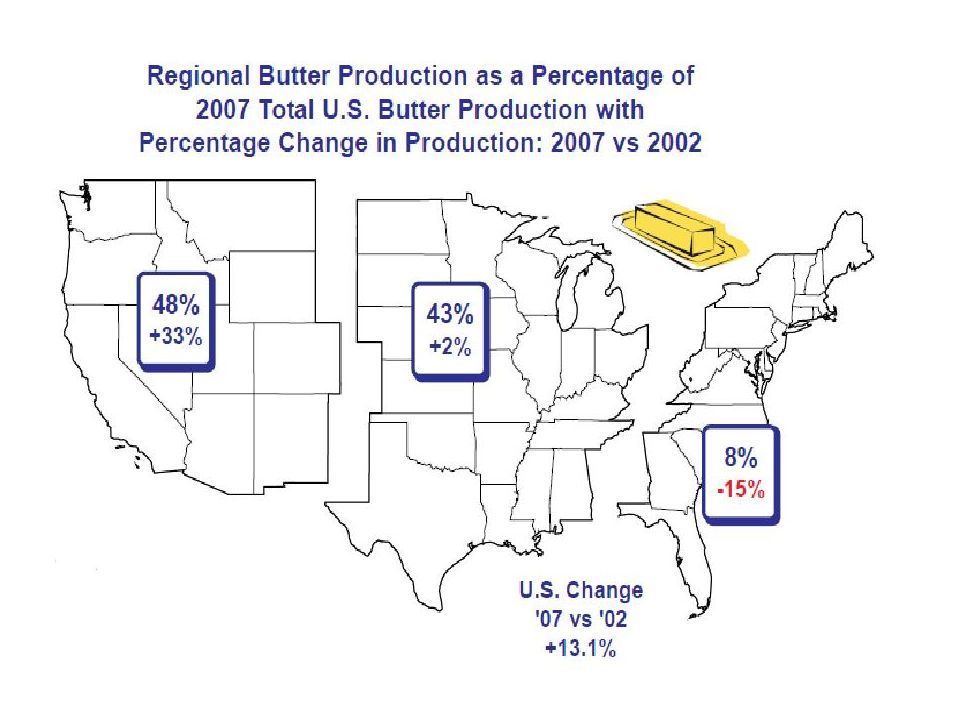
Regional Butter Production as a Percent of Total U.S. Production Source: Federal Milk Market Administrator, Tulsa, April, 2005

22
U.S. Per Capita Consumption of Selected Dairy Products Source: Agricultural Statistics, NASS, USDA

24
Source: Fereral Milk Market Administrator, Tulsa, Apr, 2008

25
Regional Nonfat Dry Milk Production as a Percent of Total U.S. Production Source: Federal Milk Market Administrator, Tulsa, April, 2002

27
Source: Fereral Milk Market Administrator, Tulsa, Apr, 2008

28
CONSUMER TRENDS (ETHNICITY ) U.S. population will be nearly 50% non white by year 2050 20002050 White72%53% Hispanic11%25% African American12%14% Asian4%8% Native American1%1% Trend will be led by an increase in Hispanic population of more than 125%

29
Source: ERS data, USDA Net Removals, Milk Equivalent-Milkfat Basis, 8/23/05 CCC Net Removals (milk equivalent, milkfat basis)
")
Similar presentations