Download presentation
Presentation is loading. Please wait.

2
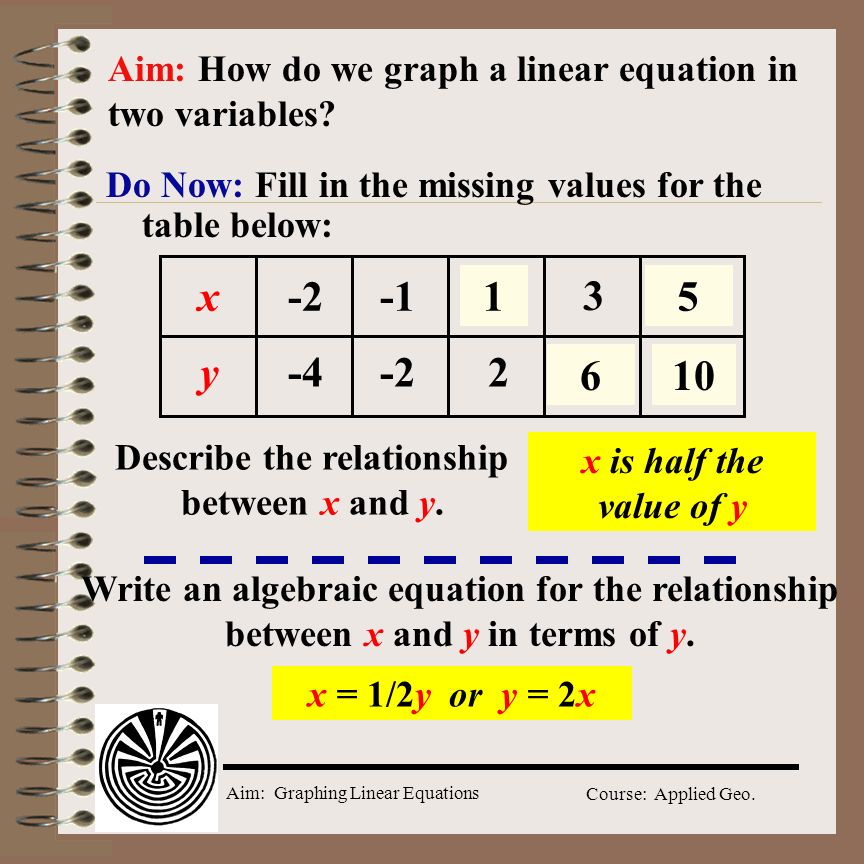
Aim: Graphing Linear Equations Course: Applied Geo. Do Now: Fill in the missing values for the table below: Aim: How do we graph a linear equation in two variables? x-2 3 ? y-4-22?? ?1 6 5 10 Describe the relationship between x and y. x is half the value of y Write an algebraic equation for the relationship between x and y in terms of y. x = 1/2y or y = 2x

3
Aim: Graphing Linear Equations Course: Applied Geo. Graphing Linear Equations x 123456789 -2-3-4-5-6 1 2 3 4 5 6 -2 -3 -4 -5 -6 -7 -8 -9 Plot the (x, y) ordered pairs from the DO NOW on the coordinate axes below and connect them. y = 2x yields a straight line and is therefore called a linear equation – a first degree equation (greatest exponent is 1) y = 2x (4, 8) (2, 4) y 7 8 All coordinate points on the same line have the same relationship and satisfy the linear equation that defines the relationship (-2, -4) (-1, -2) (1, 2) (3, 6) (5, 10)
 ordered pairs from the DO NOW on the coordinate axes below and connect them. y = 2x yields a straight line and is therefore called a linear equation – a first degree equation (greatest exponent is 1) y = 2x (4, 8) (2, 4) y 7 8 All coordinate points on the same line have the same relationship and satisfy the linear equation that defines the relationship (-2, -4) (-1, -2) (1, 2) (3, 6) (5, 10).")
4
Aim: Graphing Linear Equations Course: Applied Geo. Model Problem Does point (2, -3) lie on the graph of x - 2y = -4 If (2, -3) satisfies the relationship, or in other words, is a solution for the equation of the relationship, then it lies on the line. x - 2y = -4 2 - 2(-3) = -4 2 - (-6) = -4 2 + 6 = -4 8 = -4 This is false, therefore point (2, -3) does not lie on the line x - 2y = -4 Does point (1, 3) lie on the graph of 2y + x = 7 2(3) + 1 = 77 = 7YES
 lie on the graph of x - 2y = -4 If (2, -3) satisfies the relationship, or in other words, is a solution for the equation of the relationship, then it lies on the line. x - 2y = (-3) = (-6) = = -4 8 = -4 This is false, therefore point (2, -3) does not lie on the line x - 2y = -4 Does point (1, 3) lie on the graph of 2y + x = 7 2(3) + 1 = 77 = 7YES.")
5
Aim: Graphing Linear Equations Course: Applied Geo. Model Problem What must be the value of d if (d, 4) lies on line 3x + y = 10? d represents the x value of the coordinate pair and 4 the y value. 3d + 4 = 10 3x + y = 10 - 4 -4 3d = 6 33 d = 2 (2, 4)
 lies on line 3x + y = 10. d represents the x value of the coordinate pair and 4 the y value. 3d + 4 = 10 3x + y = d = 6 33 d = 2 (2, 4).")
6
Aim: Graphing Linear Equations Course: Applied Geo. x y 123456789 -2-3-4-5-6 1 2 3 4 5 6 7 8 9 -2 -3 -4 -5 -6 -7 -8 -9 2x + y = 4 Model Problem When given a linear equation, how do we graph the straight line that represents it? -2x y = 4 - 2x 2x + y = 4 0 1 2 4 2 0 4 - 2(0) 4 - 2(1) 4 - 2(2) xy4 - 2x 1. Transform equation to y = 2. Choose 3 convenient values for x and evaluate the equation for y 3. Plot the resulting coordinate points 4. Draw a line through the points and label the line with the equation.
 4 - 2(1) 4 - 2(2) xy4 - 2x 1. Transform equation to y = 2. Choose 3 convenient values for x and evaluate the equation for y 3. Plot the resulting coordinate points 4. Draw a line through the points and label the line with the equation..")
7
Aim: Graphing Linear Equations Course: Applied Geo. Model Problem Complete the table of values and graph the solution. x y 123456789 -2-3-4-5-6 1 2 3 4 5 6 7 8 9 -2 -3 -4 -5 -6 -7 -8 -9 xy4 - 3x -3x -3x y = 4 - 3x 3x + y = 4 0 1 2 4 1 -2 4 - 3(0) 4 - 3(1) 4 - 3(2)
 4 - 3(1) 4 - 3(2).")
8
Aim: Graphing Linear Equations Course: Applied Geo. Model Problem Complete the table of values and graph the solution. x y 123456789 -2-3-4-5-6 1 2 3 4 5 6 7 8 9 -2 -3 -4 -5 -6 -7 -8 -9 xy2/3 x +1 y = 2/3 x +1 3 0 -3 3 1 -1 2/3(3) +1 2/3(0) +1 2/3(-3)+1 y = 2 / 3 x + 1
 +1 2/3(0) +1 2/3(-3)+1 y = 2 / 3 x + 1.")
Similar presentations


 that satisfy the.>")


 2x + y = 9 2.) -x = y + 3 3.) 2y – 4 = 3x 4.) 2 = y – ⅓x 5.) 7x – y = -8 6.) 3y – 1 = -3x -2x -2x - 3.>")

