Download presentation
Presentation is loading. Please wait.

1
Oligopoly 寡头垄断

2
A monopoly is an industry consisting a single firm. A duopoly is an industry consisting of two firms. An oligopoly is an industry consisting of a few firms. Particularly, each firm’s own price or output decisions affect its competitors’ profits.

3
Copyright © 2004 South-Western Tap water Cable TV Monopoly Novels Movies Monopolistic Competition Tennis balls Crude oil Oligopoly Number of Firms? Perfect Wheat Milk Competition Type of Products? Identical products Differentiated products One firm Few firms Many firms

4
How do we analyze markets in which the supplying industry is oligopolistic? Consider the duopolistic case of two firms supplying the same product.

5
Assume that firms compete by choosing output levels. If firm 1 produces y 1 units and firm 2 produces y 2 units then total quantity supplied is y 1 + y 2. The market price will be p(y 1 + y 2 ). The firms’ total cost functions are c 1 (y 1 ) and c 2 (y 2 ).
. The firms’ total cost functions are c 1 (y 1 ) and c 2 (y 2 )..")
7
Suppose firm 1 takes firm 2’s output level choice y 2 as given. Then firm 1 sees its profit function as Given y 2, what output level y 1 maximizes firm 1’s profit?

8
Suppose that the market inverse demand function is and that the firms’ total cost functions are and

9
Then, for given y 2, firm 1’s profit function is So, given y 2, firm 1’s profit-maximizing output level solves I.e. firm 1’s best response to y 2 is

10
y2y2 y1y1 60 15 Firm 1’s “reaction curve”

11
Similarly, given y 1, firm 2’s profit function is So, given y 1, firm 2’s profit-maximizing output level solves I.e. firm 2’s best response to y 1 is

12
y2y2 y1y1 Firm 2’s “reaction curve” 45/4 45

13
An equilibrium is when each firm’s output level is a best response to the other firm’s output level, for then neither wants to deviate from its output level. A pair of output levels (y 1 *,y 2 *) is a Cournot-Nash equilibrium (古诺均衡) if and
 is a Cournot-Nash equilibrium (古诺均衡) if and.")
14
Substitute for y 2 * to get Hence So the Cournot-Nash equilibrium is

15
y2y2 y1y1 Firm 2’s “reaction curve” 60 15 Firm 1’s “reaction curve” 45/4 45

16
y2y2 y1y1 Firm 2’s “reaction curve” 48 60 Firm 1’s “reaction curve” 8 13 Cournot-Nash equilibrium

17
Generally, given firm 2’s chosen output level y 2, firm 1’s profit function is and the profit-maximizing value of y 1 solves The solution, y 1 = R 1 (y 2 ), is firm 1’s Cournot- Nash reaction to y 2.
, is firm 1’s Cournot- Nash reaction to y 2.")
18
Similarly, given firm 1’s chosen output level y 1, firm 2’s profit function is and the profit-maximizing value of y 2 solves The solution, y 2 = R 2 (y 1 ), is firm 2’s Cournot- Nash reaction to y 1.
, is firm 2’s Cournot- Nash reaction to y 1.")
19
y2y2 y1y1 Firm 1’s “reaction curve” Cournot-Nash equilibrium y 1 * = R 1 (y 2 *) and y 2 * = R 2 (y 1 *)
 and y 2 * = R 2 (y 1 *)")
20
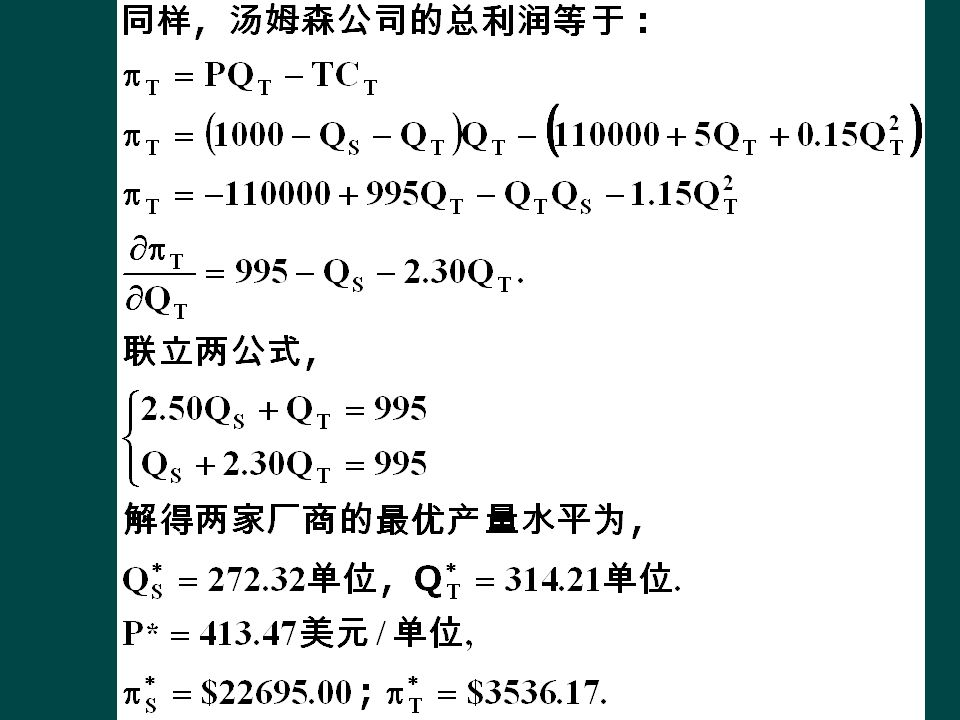
Case: Cournot Solution: 假设两家欧洲电子公司西门子 ( 厂商 S) 和汤姆森 -CSF( 厂商 T) 共同持有一项用于机场雷达系统的零件的专利权. (13-1) (13-3) (13-2)
 (13-3) (13-2).")
22
For firm 1, an iso-profit curve contains all the output pairs (y 1,y 2 ) giving firm 1 the same profit level 1. What do iso-profit curves look like?

23
y2y2 y1y1 Iso-Profit Curves for Firm 1 With y 1 fixed, firm 1’s profit increases as y 2 decreases.

24
y2y2 y1y1 Increasing profit for firm 1. Iso-Profit Curves for Firm 1

25
y2y2 y1y1 Q: Firm 2 chooses y 2 = y 2 ’. Where along the line y 2 = y 2 ’ is the output level that maximizes firm 1’s profit? y2’y2’

26
y2y2 y1y1 Iso-Profit Curves for Firm 1 Q: Firm 2 chooses y 2 = y 2 ’. Where along the line y 2 = y 2 ’ is the output level that maximizes firm 1’s profit? A: The point attaining the highest iso-profit curve for firm 1. y 1 ’ is firm 1’s best response to y 2 = y 2 ’. y2’y2’ y1’y1’

27
y2y2 y1y1 Iso-Profit Curves for Firm 1 Q: Firm 2 chooses y 2 = y 2 ’. Where along the line y 2 = y 2 ’ is the output level that maximizes firm 1’s profit? A: The point attaining the highest iso-profit curve for firm 1. y 1 ’ is firm 1’s best response to y 2 = y 2 ’. y2’y2’ R 1 (y 2 ’)
.")
28
y2y2 y1y1 y2’y2’ y2”y2” R 1 (y 2 ”) Iso-Profit Curves for Firm 1
 Iso-Profit Curves for Firm 1")
29
y2y2 y1y1 y2’y2’ y2”y2” R 1 (y 2 ”) R 1 (y 2 ’) Firm 1’s reaction curve (反应曲线) passes through the “tops”of firm 1’s iso-profit curves. Iso-Profit Curves for Firm 1

30
y2y2 y1y1 Iso-Profit Curves for Firm 2 Increasing profit for firm 2.

31
y2y2 y1y1 Iso-Profit Curves for Firm 2 Firm 2’s reaction curve passes through the “tops” of firm 2’s iso-profit curves. y 2 = R 2 (y 1 )
.")
32
Question: How to find Cournot Nash Equilibrium solution? What if N is a number big enough?

33
Q: Are the Cournot-Nash equilibrium profits the largest that the firms can earn in total?

34
y2y2 y1y1 y1*y1* y2*y2* Are there other output level pairs (y 1,y 2 ) that give higher profits to both firms? (y 1 *,y 2 *) is the Cournot-Nash equilibrium.
 is the Cournot-Nash equilibrium..")
35
y2y2 y1y1 y1*y1* y2*y2* Are there other output level pairs (y 1,y 2 ) that give higher profits to both firms? (y 1 *,y 2 *) is the Cournot-Nash equilibrium.
 is the Cournot-Nash equilibrium..")
36
y2y2 y1y1 y1*y1* y2*y2* Are there other output level pairs (y 1,y 2 ) that give higher profits to both firms? (y 1 *,y 2 *) is the Cournot-Nash equilibrium.
 is the Cournot-Nash equilibrium..")
37
y2y2 y1y1 y1*y1* y2*y2* Higher 2 Higher 1

38
y2y2 y1y1 y1*y1* y2*y2* Higher 2 Higher 1 y2’y2’ y1’y1’

39
y2y2 y1y1 y1*y1* y2*y2* y2’y2’ y1’y1’ Higher 2 Higher 1

40
y2y2 y1y1 y1*y1* y2*y2* y2’y2’ y1’y1’ Higher 2 Higher 1 (y 1 ’,y 2 ’) earns higher profits for both firms than does (y 1 *,y 2 *).
 earns higher profits for both firms than does (y 1 *,y 2 *).")
41
So there are profit incentives for both firms to “cooperate” by lowering their output levels. This is collusion. Firms that collude are said to have formed a cartel (卡特尔). If firms form a cartel, how should they do it?
. If firms form a cartel, how should they do it .")
42
Suppose the two firms want to maximize their total profit and divide it between them. Their goal is to choose cooperatively output levels y 1 and y 2 that maximize

43
The firms cannot do worse by colluding since they can cooperatively choose their Cournot-Nash equilibrium output levels and so earn their Cournot-Nash equilibrium profits. So collusion must provide profits at least as large as their Cournot-Nash equilibrium profits.

44
y2y2 y1y1 y1*y1* y2*y2* y2’y2’ y1’y1’ Higher 2 Higher 1 (y 1 ’,y 2 ’) earns higher profits for both firms than does (y 1 *,y 2 *).
 earns higher profits for both firms than does (y 1 *,y 2 *).")
45
y2y2 y1y1 y1*y1* y2*y2* y2’y2’ y1’y1’ Higher 2 Higher 1 (y 1 ’,y 2 ’) earns higher profits for both firms than does (y 1 *,y 2 *). (y 1 ”,y 2 ”) earns still higher profits for both firms. y2”y2” y1”y1”
 earns still higher profits for both firms. y2 y2 y1 y1 .")
46
y2y2 y1y1 y1*y1* y2*y2* y2y2 ~ y1y1 ~ (y 1,y 2 ) maximizes firm 1’s profit while leaving firm 2’s profit at the Cournot-Nash equilibrium level. ~~

47
y2y2 y1y1 y1*y1* y2*y2* y2y2 ~ y1y1 ~ ~~ y2y2 _ y2y2 _ (y 1,y 2 ) maximizes firm 2’s profit while leaving firm 1’s profit at the Cournot-Nash equilibrium level. __

48
y2y2 y1y1 y1*y1* y2*y2* y2y2 ~ y1y1 ~ y2y2 _ y2y2 _ The path of output pairs that maximize one firm’s profit while giving the other firm at least its CN equilibrium profit.

49
y2y2 y1y1 y1*y1* y2*y2* y2y2 ~ y1y1 ~ y2y2 _ y2y2 _ The path of output pairs that maximize one firm’s profit while giving the other firm at least its CN equilibrium profit. One of these output pairs must maximize the cartel’s joint profit.

50
y2y2 y1y1 y1*y1* y2*y2* y2my2m y1my1m (y 1 m,y 2 m ) denotes the output levels that maximize the cartel’s total profit.
 denotes the output levels that maximize the cartel’s total profit.")
51
Is such a cartel stable? Does one firm have an incentive to cheat on the other? I.e. if firm 1 continues to produce y 1 m units, is it profit-maximizing for firm 2 to continue to produce y 2 m units?

52
Firm 2’s profit-maximizing response to y 1 = y 1 m is y 2 = R 2 (y 1 m ).
.")
53
y2y2 y1y1 y2my2m y1my1m y 2 = R 2 (y 1 m ) is firm 2’s best response to firm 1 choosing y 1 = y 1 m. R 2 (y 1 m ) y 1 = R 1 (y 2 ), firm 1’s reaction curve y 2 = R 2 (y 1 ), firm 2’s reaction curve
 y 1 = R 1 (y 2 ), firm 1’s reaction curve y 2 = R 2 (y 1 ), firm 2’s reaction curve.")
54
Firm 2’s profit-maximizing response to y 1 = y 1 m is y 2 = R 2 (y 1 m ) > y 2 m. Firm 2’s profit increases if it cheats on firm 1 by increasing its output level from y 2 m to R 2 (y 1 m ). Similarly, firm 1’s profit increases if it cheats on firm 2 by increasing its output level from y 1 m to R 1 (y 2 m ).
. Similarly, firm 1’s profit increases if it cheats on firm 2 by increasing its output level from y 1 m to R 1 (y 2 m )..")
55
y2y2 y1y1 y2my2m y1my1m y 2 = R 2 (y 1 m ) is firm 2’s best response to firm 1 choosing y 1 = y 1 m. R 1 (y 2 m ) y 1 = R 1 (y 2 ), firm 1’s reaction curve y 2 = R 2 (y 1 ), firm 2’s reaction curve
 y 1 = R 1 (y 2 ), firm 1’s reaction curve y 2 = R 2 (y 1 ), firm 2’s reaction curve.")
56
So a profit-seeking cartel in which firms cooperatively set their output levels is fundamentally unstable. E.g. OPEC’s broken agreements.

57
Sometimes collusion succeeds Sometimes forces of competition win out over collective action When will collusion tend to succeed? There are six factors that influence successful collusion as follows:

58
1.Number and Size Distribution of Sellers. Collusion is more successful with few firms or if there exists a dominant firm. 2.Product Heterogeneity. Collusion is more successful with products that are standardized or homogeneous 3.Cost Structures. Collusion is more successful when the costs are similar for all of the firms in the oligopoly. 4.Size and Frequency of Orders. Collusion is more successful with small, frequent orders. 5. Secrecy and Retaliation. Collusion is more successful when it is difficult to give secret price concessions. 6.Percentage of External Orders. Collusion is more successful when percentage of orders outside of the cartel is small.

59
So far it has been assumed that firms choose their output levels simultaneously. The competition between the firms is then a simultaneous play game in which the output levels are the strategic variables.

60
What if firm 1 chooses its output level first and then firm 2 responds to this choice? Firm 1 is then a leader (领导者). Firm 2 is a follower (追随者). The competition is a sequential game in which the output levels are the strategic variables.
. Firm 2 is a follower (追随者). The competition is a sequential game in which the output levels are the strategic variables..")
61
Such games are Stackelberg (斯塔克尔伯格) games. Is it better to be the leader? Or is it better to be the follower?

62
Q: What is the best response that follower firm 2 can make to the choice y 1 already made by the leader, firm 1? A: Choose y 2 = R 2 (y 1 ). Firm 1 knows this and so perfectly anticipates firm 2’s reaction to any y 1 chosen by firm 1.
. Firm 1 knows this and so perfectly anticipates firm 2’s reaction to any y 1 chosen by firm 1..")
63
This makes the leader’s profit function The leader then chooses y 1 to maximize its profit level. Q: Will the leader make a profit at least as large as its Cournot-Nash equilibrium profit?

64
A: Yes. The leader could choose its Cournot- Nash output level, knowing that the follower would then also choose its C-N output level. The leader’s profit would then be its C-N profit. But the leader does not have to do this, so its profit must be at least as large as its C-N profit.

65
The market inverse demand function is p = 60 - y T. The firms’ cost functions are c 1 (y 1 ) = y 1 2 and c 2 (y 2 ) = 15y 2 + y 2 2. Firm 2 is the follower. Its reaction function is
 = y 1 2 and c 2 (y 2 ) = 15y 2 + y 2 2. Firm 2 is the follower. Its reaction function is.")
66
The leader’s profit function is therefore

67
For a profit-maximum,

68
Q: What is firm 2’s response to the leader’s choice

69
Q: What is firm 2’s response to the leader’s choice A:

70
Q: What is firm 2’s response to the leader’s choice A: The C-N output levels are (y 1 *,y 2 *) = (13,8) so the leader produces more than its C-N output and the follower produces less than its C-N output. This is true generally.

71
y2y2 y1y1 y1*y1* y2*y2* (y 1 *,y 2 *) is the Cournot-Nash equilibrium. Higher 2 Higher 1
 is the Cournot-Nash equilibrium. Higher 2 Higher 1")
72
y2y2 y1y1 y1*y1* y2*y2* (y 1 *,y 2 *) is the Cournot-Nash equilibrium. Higher 1 Follower’s reaction curve

73
y2y2 y1y1 y1*y1* y2*y2* (y 1 *,y 2 *) is the Cournot-Nash equilibrium. (y 1 S,y 2 S ) is the Stackelberg equilibrium. Higher 1 y1Sy1S Follower’s reaction curve y2Sy2S
 is the Stackelberg equilibrium. Higher 1 y1Sy1S Follower’s reaction curve y2Sy2S.")
74
y2y2 y1y1 y1*y1* y2*y2* (y 1 *,y 2 *) is the Cournot-Nash equilibrium. (y 1 S,y 2 S ) is the Stackelberg equilibrium. y1Sy1S Follower’s reaction curve y2Sy2S
 is the Stackelberg equilibrium. y1Sy1S Follower’s reaction curve y2Sy2S.")
75
What if firms compete using only price-setting strategies, instead of using only quantity-setting strategies? Games in which firms use only price strategies and play simultaneously are Bertrand games.

76
Each firm’s marginal production cost is constant at c. All firms simultaneously set their prices. Q: Is there a Nash equilibrium? A: Yes. Exactly one. All firms set their prices equal to the marginal cost c. Why?

77
Suppose one firm sets its price higher than another firm’s price. Then the higher-priced firm would have no customers. Hence, at an equilibrium, all firms must set the same price.

78
Suppose the common price set by all firm is higher than marginal cost c. Then one firm can just slightly lower its price and sell to all the buyers, thereby increasing its profit. The only common price which prevents undercutting is c. Hence this is the only Nash equilibrium.

79
据尼尔森最新统计:康师傅,华龙与统一在市 场占有率上依次排列,形成三分天下格局。 为什么华龙集团能够从一家小型乡镇民营企业 发展起来? 低价面铺市场,中档面创效益,高档面树形象 。

80
What if, instead of simultaneous play in pricing strategies, one firm decides its price ahead of the others. This is a sequential game in pricing strategies called a price-leadership game (价格领导). The firm which sets its price ahead of the other firms is the price-leader.
. The firm which sets its price ahead of the other firms is the price-leader..")
81
Think of one large firm (the leader) and many competitive small firms (the followers). The small firms are price-takers and so their collective supply reaction to a market price p is their aggregate supply function Y f (p).
..")
82
The market demand function is D(p). So the leader knows that if it sets a price p the quantity demanded from it will be the residual demand (剩余需求曲线) Hence the leader’s profit function is
 Hence the leader’s profit function is.")
83
The leader’s profit function is so the leader chooses the price level p* for which profit is maximized. The followers collectively supply Y f (p*) units and the leader supplies the residual quantity D(p*) - Y f (p*).
 units and the leader supplies the residual quantity D(p*) - Y f (p*)..")
84
Demand: D(p)=a-bp Cost: Leader: c 1 (y 1 )=cy 1 Follower: c 2 (y 2 )= y 2 2 /2 Follower’s supply: p= y 2 Residual demand for leader: R(p)=D(p)-S 2 (p)=a-bp-p=a-(b+1)p Solve for a monopoly problem
=a-bp Cost: Leader: c 1 (y 1 )=cy 1 Follower: c 2 (y 2 )= y 2 2 /2 Follower’s supply: p= y 2 Residual demand for leader: R(p)=D(p)-S 2 (p)=a-bp-p=a-(b+1)p Solve for a monopoly problem")
85
£ Q O S all other firms D market D leader PLPL MR leader QLQL QFQF QTQT f t Determination of price and output l Dominant firm price leadership D leader MC leader

Similar presentations


 n Stackelberg duopoly (sequential quantity competition) x2x2 x1x1 x1x2x1x2.>")


