Download presentation
Presentation is loading. Please wait.

1
Chapter 9 Capacity and Level of Service for Highway Segments
Dr. Yahya Sarraj Faculty of Engineering The Islamic University of Gaza

2
Capacity and Level of Service
Traffic flows reasonably well when the flow rate is less than at capacity, but … excessive delay and congestion can occur when the flow rate is at or near capacity.

3
Capacity and Level of Service
Capacity analysis involves the quantitative evaluation of the capability of a road section to carry traffic, and it uses a set of procedures to determine the maximum flow of traffic that a given section of highway will carry under prevailing roadway traffic and control conditions.

4
Capacity and Level of Service
The measure of quality of flow is the “level of service” (LOS), a qualitative measure, ranging from A to F, This chapter presents procedures for determining the level of service on: two-lane and multilane highways and freeways.
, a qualitative measure, ranging from A to F, This chapter presents procedures for determining the level of service on: two-lane and. multilane highways and. freeways.")
5
Capacity and Level of Service
Figure 9.1 Typical Two-Lane, Two-Way Highway in a Rural Environment SOURCE: Highway Capacity Manual 2000.

6
Capacity and Level of Service
Two-Lane, Two-Way Highway in a Rural Environment

7
Capacity and Level of Service
Two-Lane, Two-Way Highway in a Rural Environment

8
Capacity and Level of Service
Two-Lane, Two-Way Highway in a Rural Environment

9
Capacity and Level of Service
Two-Lane, Two-Way Highway in a Rural Environment

10
Capacity and Level of Service
9.1 TWO-LANE HIGHWAYS The procedures developed for two-lane highway segments provide the basis to evaluate level of service and capacity. two levels of analysis: (1) Operational; (2) Planning applications.
 Operational; (2) Planning applications.")
11
Capacity and Level of Service
Planning applications Use estimates and default values in calculations. Two classes of two-lane highways are analyzed. Class I. primary arterials, daily commuter routes, and links to other arterial highways. travel will be at relatively high speeds. Class II. Travel speeds will be lower than for Class I roads.

12
Capacity and Level of Service
Operational applications At an operational level of analysis, level of service is determined based on: existing traffic conditions or future traffic conditions and specific roadway characteristics.

13
Capacity and Level of Service
The Highway Capacity Manual (HCM) procedure is designed to analyze two-lane highway segments for: (1) two-way traffic, (2) for a specific direction, or (3) for a directional segment with a passing lane.
 procedure is designed to analyze two-lane highway segments for: (1) two-way traffic, (2) for a specific direction, or. (3) for a directional segment with a passing lane.")
14
Capacity and Level of Service
There are two measures used to describe the service quality of a two-lane highway. These are: (1) (PTSF) percent time following another vehicle, & (2) (ATS) average travel speed.
 (PTSF) percent time following another vehicle, & (2) (ATS) average travel speed.")
15
Capacity and Level of Service
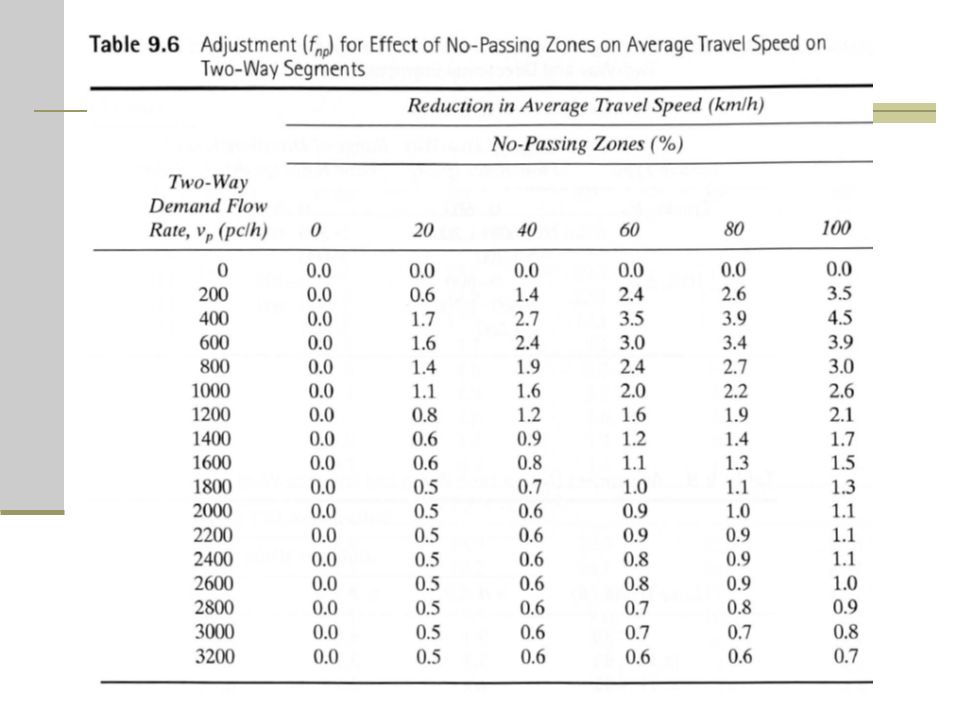
1. Percent time-spent-following another vehicle (PTSF) is the average percentage of time that vehicles are traveling behind slower vehicles. When “headway” is < 3 seconds, the trailing vehicle is considered to be following the lead vehicle. PTSF is a measure of the quality of service provided by the highway.
 is the average percentage of time that vehicles are traveling behind slower vehicles. When headway is < 3 seconds, the trailing vehicle is considered to be following the lead vehicle. PTSF is a measure of the quality of service provided by the highway.")
16
Capacity and Level of Service
2. Average travel speed (ATS) is the space mean speed of vehicles in the traffic stream. ATS is a measure of the degree of providing efficient mobility.
 is the space mean speed of vehicles in the traffic stream. ATS is a measure of the degree of providing efficient mobility.")
17
Capacity and Level of Service
Figure 9.2 Speed-Flow and Percent Time-Spent-Following Flow Relationships for Two-Way Segments with Base Conditions

18
Capacity and Level of Service
Figure 9.2 Speed-Flow and Percent Time-Spent-Following Flow Relationships for Two-Way Segments with Base Conditions

19
Capacity and Level of Service
Figure 9.3 Speed-Flow and Percent Time-Spent-Following Flow Relationships for Directional Segments with Base Conditions

20
Capacity and Level of Service
Figure 9.3 Speed-Flow and Percent Time-Spent-Following Flow Relationships for Directional Segments with Base Conditions

21
Capacity and Level of Service
The relationships shown in these figures are for: base conditions defined as: the absence of restrictive geometric, traffic, or environmental factors.

22
Capacity and Level of Service
Base conditions exist for the following characteristics: Level terrain Lane widths 3.6m or greater Clear shoulders 1.8m wide or greater Passing permitted with absence of no-passing zones No impediments to through traffic due to traffic control or turning vehicles Passenger cars only in the traffic stream Equal volume in both directions (for analysis of two-way flow)
")
23
Capacity and Level of Service
Capacity of a two-lane highway is 1700 passenger cars per hour (pc/h) for each direction of travel and is nearly independent of the directional distribution of traffic. For extended segments, the capacity of a two-lane highway will not exceed a combined total of 3200 pc/h. Short sections of two-lane highway, such as a tunnel or bridge, may reach a capacity of 3200 to 3400 pc/h.
 for each direction of travel and is nearly independent of the directional distribution of traffic. For extended segments, the capacity of a two-lane highway will not exceed a combined total of 3200 pc/h. Short sections of two-lane highway, such as a tunnel or bridge, may reach a capacity of 3200 to 3400 pc/h.")
24
Capacity and Level of Service
Level of Service (LOS) expresses the performance of a highway at traffic volumes less than capacity. LOS for Class I highways is based on two measures: PTSF and ATS. LOS for Class II highways is based on a single measure: PTSF.
 expresses the performance of a highway at traffic volumes less than capacity. LOS for Class I highways is based on two measures: PTSF and ATS. LOS for Class II highways is based on a single measure: PTSF.")
25
Capacity and Level of Service
Level-of-service criteria are applied to travel during the peak 15 minutes of travel and on highway segments of significant length. Level-of-service designations are from A (highest) to F (lowest).
 to F (lowest).")
26
Capacity and Level of Service
Level of Service A: This is the highest quality of service. desired speed. passing other vehicles. few (if any) platoons of three or more cars.
 platoons of three or more cars.")
27
Capacity and Level of Service
Class I: highway average travel speed (ATS) is 88km/h (55 mi/h) or greater, and travel delays (PTSF) occur no more than 35% of the time.
 is 88km/h (55 mi/h) or greater, and. travel delays (PTSF) occur no more than 35% of the time.")
28
Capacity and Level of Service
Class II: highway maximum delay (PTSF) is 40% of the time. Maximum service flow rate (two-way) under base conditions is 490 pc/h.
 is 40% of the time. Maximum service flow rate (two-way) under base conditions is 490 pc/h.")
29
Capacity and Level of Service
Level of Service A:

30
Capacity and Level of Service
Level of Service B:

31
Capacity and Level of Service
Level of Service C:

32
Capacity and Level of Service
Level of Service D:

33
Capacity and Level of Service
Level of Service E:

34
Capacity and Level of Service
Level of Service F: Traffic is congested with demand exceeding capacity. Volumes are lower than capacity and speeds are variable.

35
Capacity and Level of Service
Level of Service F:

36
Capacity and Level of Service
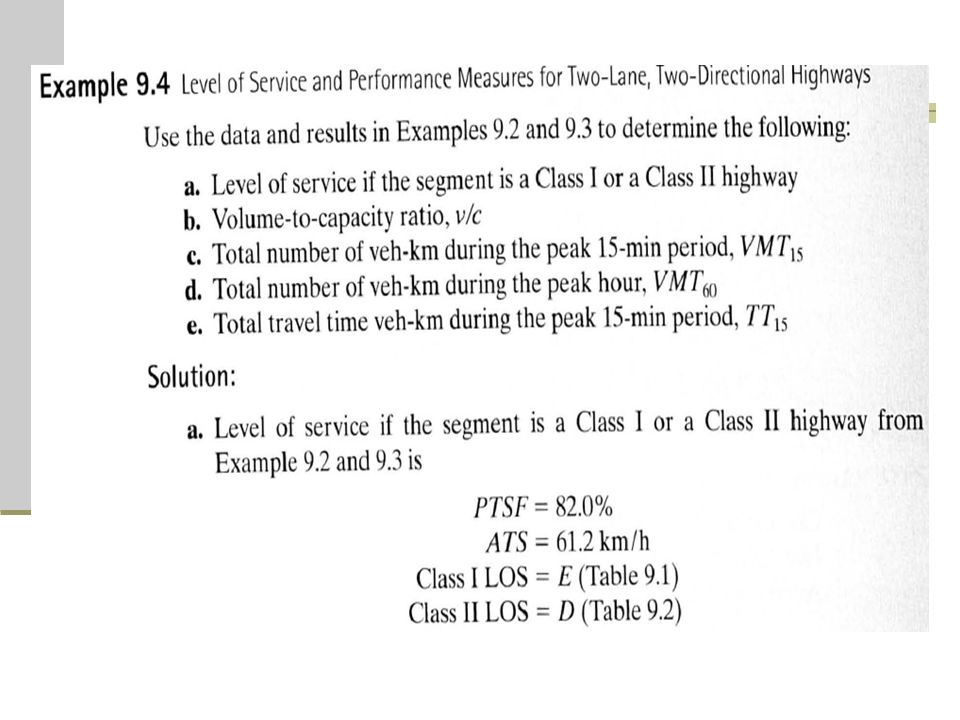
Table 9.1 (Appendix) summarizes the ranges in values of: PTSF and ATS for each level of service category for Class I two-lane roads. For Class I highways, two criteria apply: (1) percent time-spent-following (PTSF), and (2) average travel speed (ATS).
 summarizes the ranges in values of: PTSF and ATS. for each level of service category for. Class I two-lane roads. For Class I highways, two criteria apply: (1) percent time-spent-following (PTSF), and. (2) average travel speed (ATS).")
37
Km/h > 88 > 80 – 88 > 72 – 80 > 64 – 72 ≤ 64

38
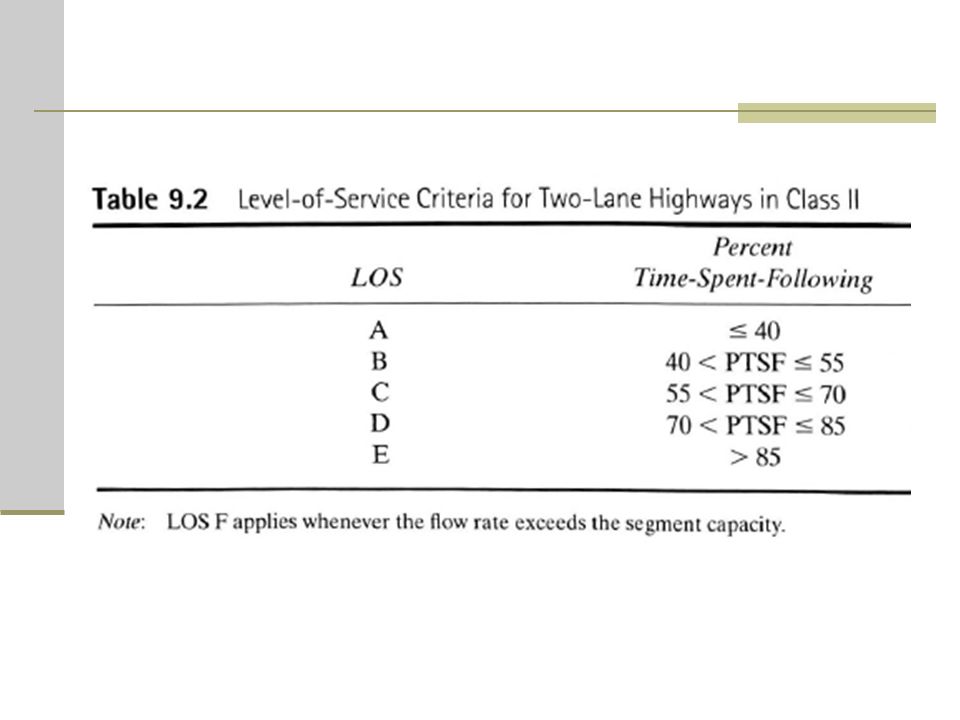
Capacity and Level of Service
Table 9.2 summarizes the ranges in values of PTSF for each level of service category for Class II two-lane roads. For Class II highways, a single criterion is used: percent time-spent-following (PTSF).
.")
40
Capacity and Level of Service

41
Capacity and Level of Service

42
Capacity and Level of Service
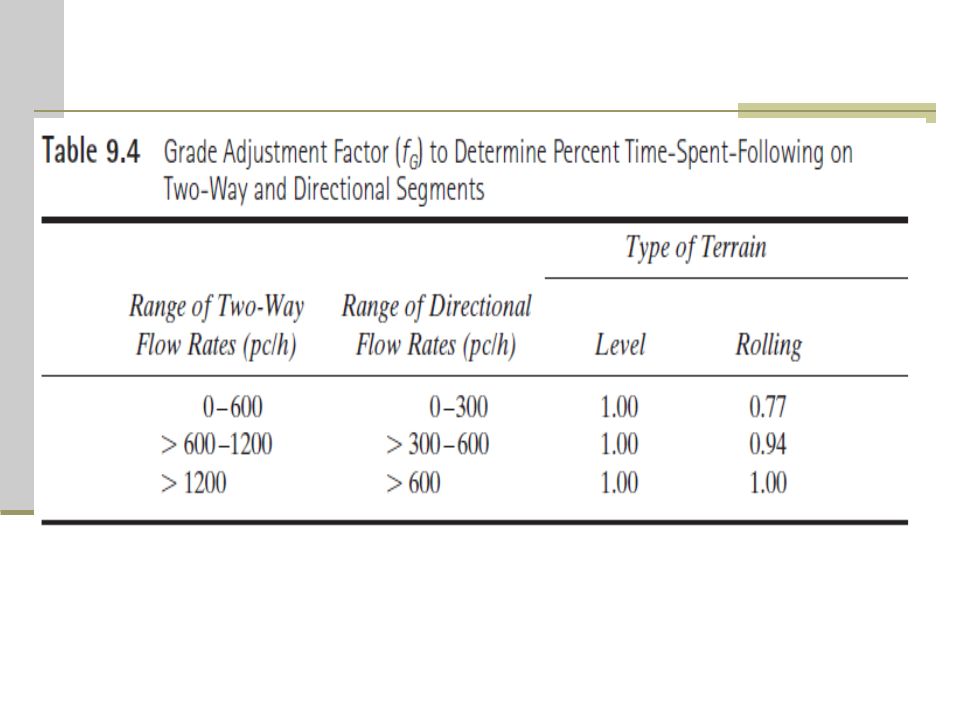
9.1.1 Procedures for Determining Level of Service Two-way segments located in level or rolling terrain. Grades are 1 to 2 percent, and heavy vehicles maintain the same speed as passenger cars.

43
2. Rolling terrain short or medium length grades of 4 % or less.
Analysis of two-lane roads for two-way segments is usually performed on: extended lengths at least 2.0 mi (3.2km) and the segment is located in level or rolling terrain. 1. Level terrain flat grades of 2 % or less. Heavy vehicles maintain the same speed as passenger cars. 2. Rolling terrain short or medium length grades of 4 % or less. Heavy truck speeds are lower than passenger cars but are not at crawl speed. If the grade > 4 %, must be analyzed using the specific grade procedure for directional segments.
 and. the segment is located in level or rolling terrain. 1. Level terrain flat grades of 2 % or less. Heavy vehicles maintain the same speed as passenger cars. 2. Rolling terrain short or medium length grades of 4 % or less. Heavy truck speeds are lower than passenger cars but are not at crawl speed. If the grade > 4 %, must be analyzed using the specific grade procedure for directional segments.")
44
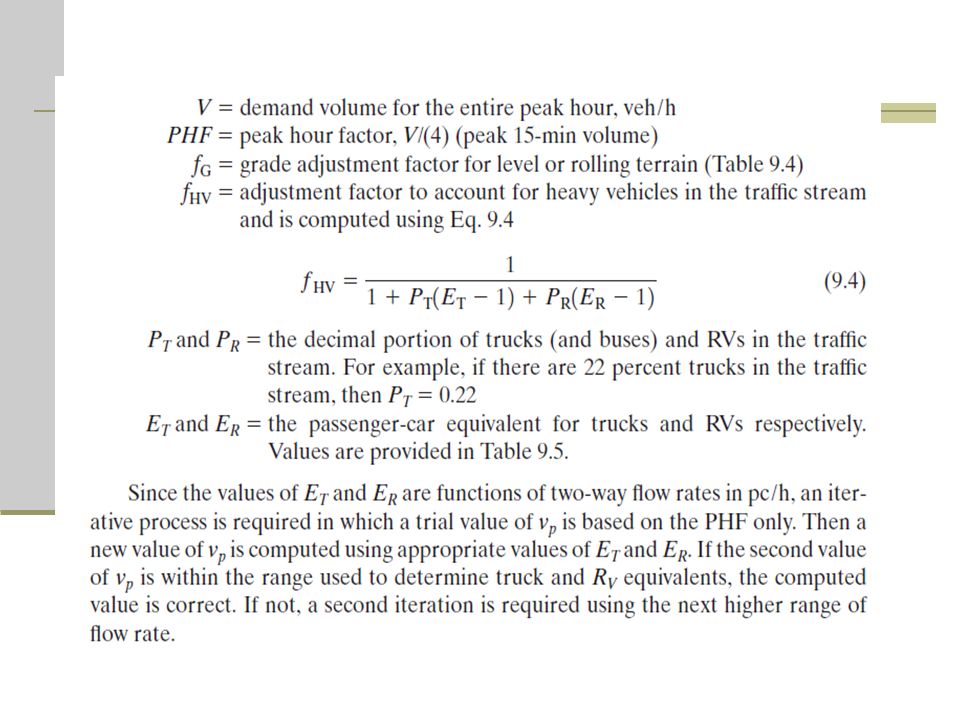
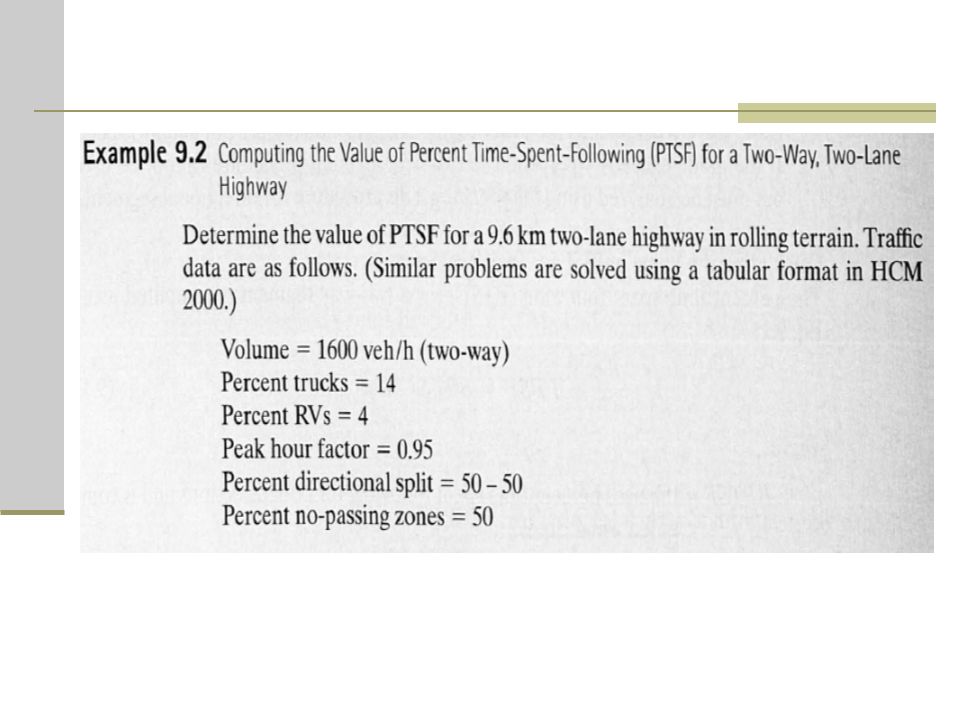
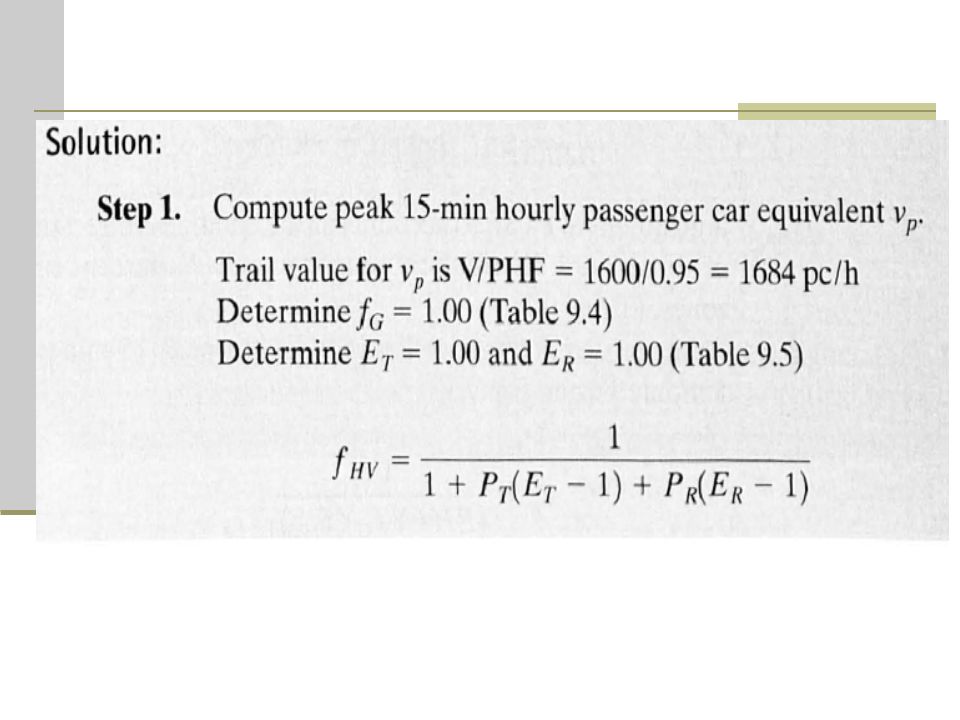
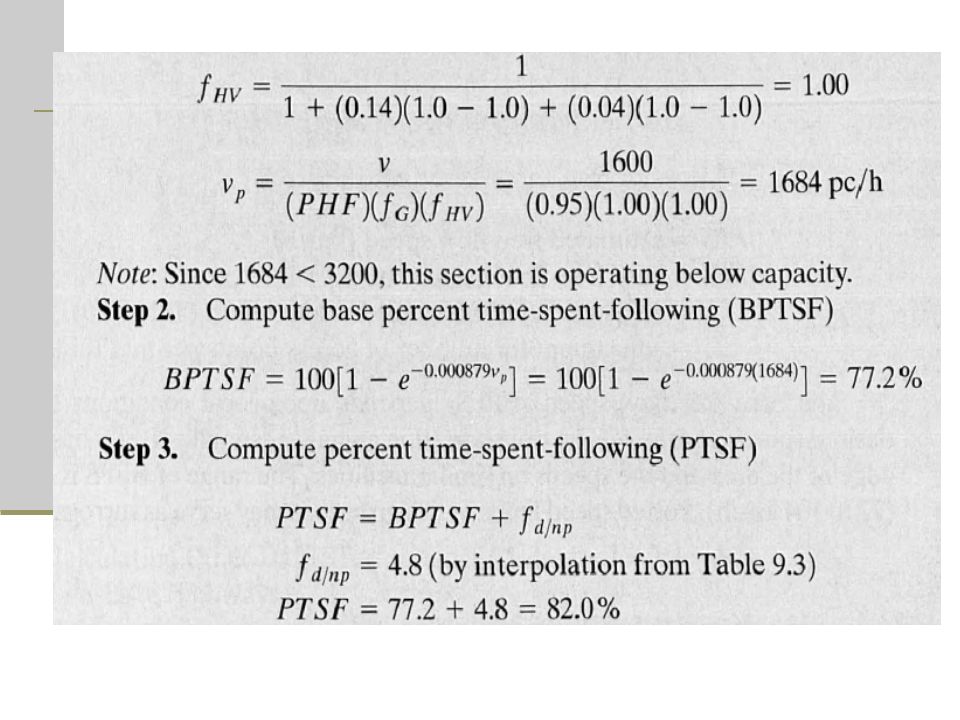
Calculating the value of PTSF of a two-lane two way segment

50
Table 9.3 (Interpolation) Increase in PTSF %
No-Passing Zones (%) 60 50 40 Vp (pc/h 6.7 6.1 5.5 1400 5.28 4.77 4.27 1684 3.7 3.3 2.9 2000
 Vp (pc/h")
Similar presentations


>")


: Capacity and Level-of-Service Analysis for Freeways and Multilane Highways Objectives of this presentation: By the end of this.>")


