Download presentation
Presentation is loading. Please wait.

1
Making line graphs How are line graphs the same as bar graphs? x- and y-axis Label axes Even spacing Title Use tickmarks

2
What is different from bar graphs? On x-axis, graph right at the tickmark Use dots and connect Line graphs are used for continuous data

3
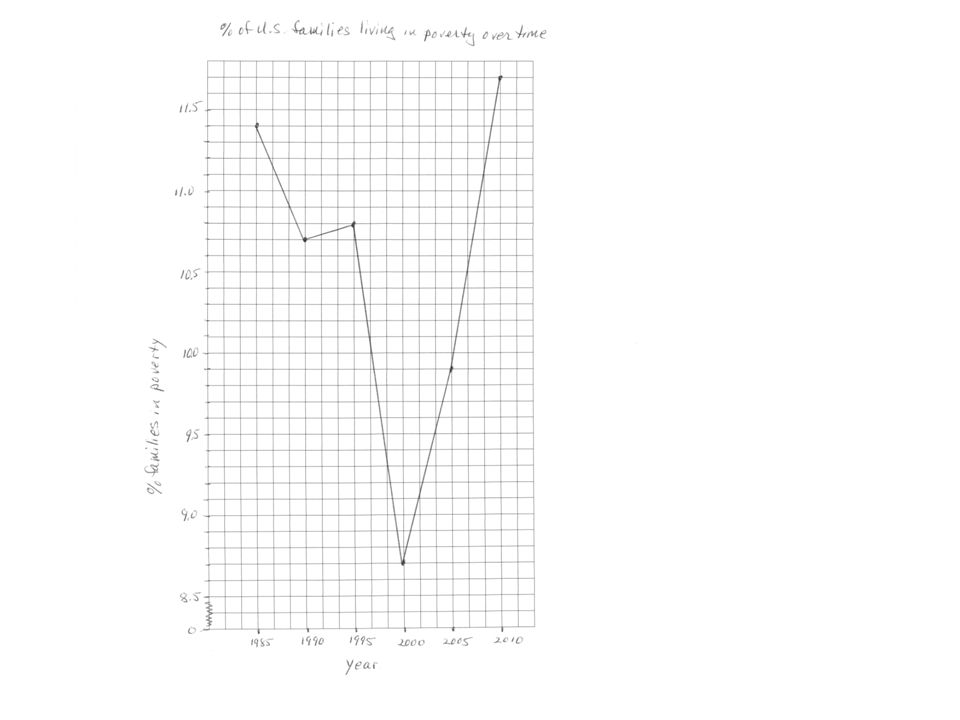
Important and tricky for all graphs Have to determine the range of data so you can put tick marks and label correctly Use a “squiggly” if you aren’t starting at 0 Sample data % families Yearliving in poverty 198511.4 199010.7 199510.8 2000 8.7 2005 9.9 201011.7 Suppose there are 20 squares on the x-axis: how many should we skip? Suppose there are 35 spaces on the y-axis: what should we count by? How many should we skip? Should we use a squiggly?

Similar presentations

 Connect data points using a line or curve of best fit.>")


0102030405060 Temperature ( o C)-10-5010121523 It is normal.>")


>")
 and D(0, 5). Then connect the points. What do you notice? Step 1 Graph point C. Start at the origin,>")


