Download presentation
Presentation is loading. Please wait.

1
HW: 3-29 through 3-34 October 20, 2015 3.1.3 What model should I use?

2
Objectives CO: SWBAT use tree diagrams and area models as ways to represent and solve probability problems. LO: SWBAT decide if a game is “fair” and explain how to calculate some expected values.

3
Warm Up 3-23. ROCK, PAPER, SCISSORS
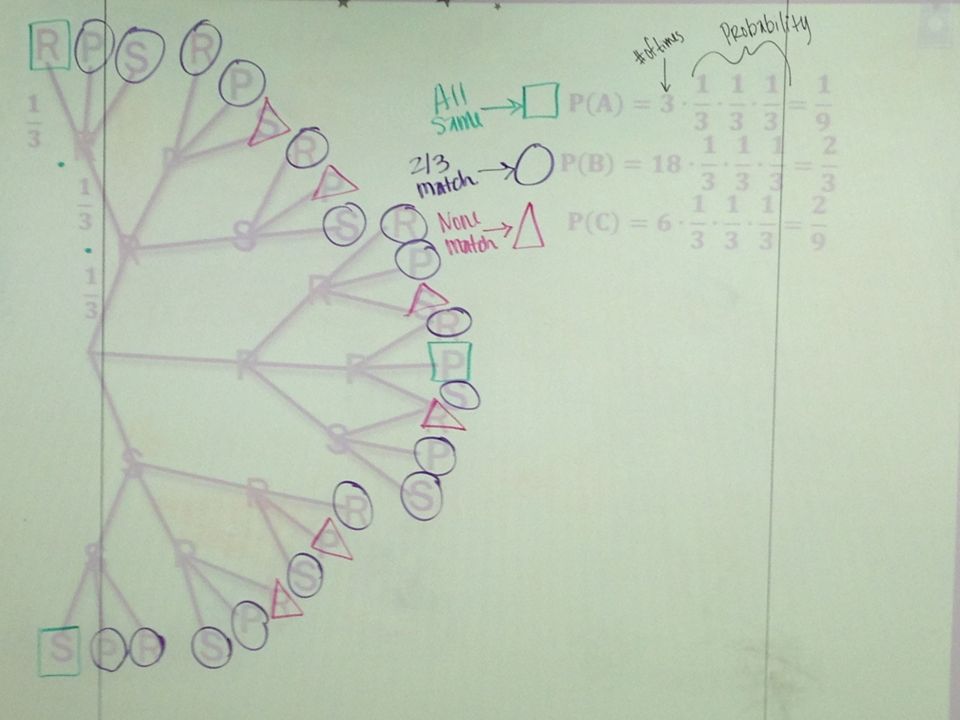
Your team will play a variation of “Rock, Paper, Scissors” (sometimes called “Rochambeau”) and record points. You will need to work in a team of four. Have one person act as Recorder while the other three play the game. #1 = Recorder, #2 = Player A, #3 = Player B, #4 = Player C. Write down who has each role. Without playing the game, discuss with your team which player you think will receive the most points by the end of the game. Assign points as follows: Player A gets a point each time all three players match. Player B gets a point each time two of the three players match. Player C gets a point each time none of the players match. Now play “Rock, Paper, Scissors” with your team at least 20 times. The Recorder should record the winner for each round. Does this game seem fair? Calculate the theoretical probability for each outcome (Player A, Player B, or Player C winning). Discuss the results with your team and be prepared to share them with the class. (Make tree) Devise a plan to make this game fair.
 and record points. You will need to work in a team of four. Have one person act as Recorder while the other three play the game. #1 = Recorder, #2 = Player A, #3 = Player B, #4 = Player C. Write down who has each role. Without playing the game, discuss with your team which player you think will receive the most points by the end of the game. Assign points as follows: Player A gets a point each time all three players match. Player B gets a point each time two of the three players match. Player C gets a point each time none of the players match. Now play Rock, Paper, Scissors with your team at least 20 times. The Recorder should record the winner for each round. Does this game seem fair Calculate the theoretical probability for each outcome (Player A, Player B, or Player C winning). Discuss the results with your team and be prepared to share them with the class. (Make tree) Devise a plan to make this game fair.")
4
R P S 𝐏 𝐀 =𝟑∙ 𝟏 𝟑 ∙ 𝟏 𝟑 ∙ 𝟏 𝟑 = 𝟏 𝟗 𝐏 𝐁 =𝟏𝟖∙ 𝟏 𝟑 ∙ 𝟏 𝟑 ∙ 𝟏 𝟑 = 𝟐 𝟑 𝐏 𝐂 =𝟔∙ 𝟏 𝟑 ∙ 𝟏 𝟑 ∙ 𝟏 𝟑 = 𝟐 𝟗 𝟏 𝟑 R P S R P S

6
3-24. There is a new game at the school fair called “Pick a Tile”, in which the player reaches into two bags and chooses one square tile and one circular tile. The bag with squares contains three yellow, one blue, and two red squares. The bag with circles has one yellow and two red circles. In order to win the game (and a large stuffed animal), a player must choose one blue square and one red circle. Since it costs $2 to play the game, Marty and Gerri decide to calculate the probability of winning before deciding whether to play. Gerri suggests they make a systematic list of all the possible color combinations in the sample space, listing squares first then circles: RY BY YY RR BR YR “So,” says Gerri, “the answer is 𝟏 𝟔 .” Warm Up R Y 𝟑 𝟔 = 𝟏 𝟐 𝟐 𝟔 = 𝟏 𝟑 𝟏 𝟔 𝟏 𝟑 𝟐 𝟑 B R Y Do you agree with Gerri’s answer? Explain. No, because there are duplicates. Make a tree diagram for this situation. Remember to take into account the duplicate tiles in the bags. What is the probability of a player choosing the winning {blue square, red circle} combination? P(W) = 𝟏 𝟔 ∙ 𝟐 𝟑 = 𝟏 𝟗 =𝟏𝟏% Should Gerri and Marty play this game? Would you? Why or why not? No, because their chances are not very good.
 = 𝟏 𝟔 ∙ 𝟐 𝟑 = 𝟏 𝟗 =𝟏𝟏% Should Gerri and Marty play this game Would you Why or why not No, because their chances are not very good.")
7
HW: 3-29 through 3-34 October 20, 2015 3.1.3 What model should I use?

8
Objectives CO: SWBAT use tree diagrams and area models as ways to represent and solve probability problems. LO: SWBAT decide if a game is “fair” and explain how to calculate some expected values.

9
3-25. Now draw a probability area model for the “Pick a Tile” game in problem 3-24.
Use the probability area model to calculate the probability of each possible color combination of a square and a circular tile. Explain to Marty and Gerri why the probability area model is called an area model. Multiplying length times width Discuss which model you preferred using to solve the “Pick a Tile” problem with your team. What are your reasons for your preference? Could you have used the area model for the “Rock, Paper, Scissors” problem? Explain why or why not. No, because there are three situations (3 players); you would need a 3 dimensional box. Y = 𝟏 𝟑 R = 𝟐 𝟑 Y = 𝟏 𝟐 B = 𝟏 𝟔 R = 𝟏 𝟑 1 6 1 3 1 18 1 9 1 9 2 9
; you would need a 3 dimensional box. Y = 𝟏 𝟑. R = 𝟐 𝟑. Y = 𝟏 𝟐. B = 𝟏 𝟔. R = 𝟏 𝟑")
10
Progress Chart 3-26 3-27 Purple Stripes Blue Green Pink Orange Yellow
Red

11
3-26. BASKETBALL: Shooting One-and-One Free Throws
.7 Rimshot McGee has a 70% free throw average. The opposing team is ahead by one point. Rimshot is at the foul line in a one-and-one situation with just seconds left in the game. (A one-and-one situation means that Rimshot shoots a free throw and if he makes the shot, he shoots another. If he misses the first shot, he does not get a second shot. Each shot made is worth one point.) First, take a guess. What do you think is the most likely outcome for Rimshot: zero points, one point, or two points? Draw a tree diagram to represent this situation. Jeremy is working on the problem with Jenna, and he remembers that area models are sometimes useful for solving problems related to probability. They set up the probability area model at right. Discuss this model with your team. Which part of the model represents Rimshot getting one point? How can you use the model to help calculate the probability that Rimshot will get exactly one point? (0.7)(0.3) = 21% Use either your tree diagram or the area model to help you calculate the probabilities that Rimshot will get either zero or two points. What is the most likely of the three outcomes? 2 points: (0.7)(0.7) = 49% 0 points: 30% .7 .3 .3 1
 First, take a guess. What do you think is the most likely outcome for Rimshot: zero points, one point, or two points Draw a tree diagram to represent this situation. Jeremy is working on the problem with Jenna, and he remembers that area models are sometimes useful for solving problems related to probability. They set up the probability area model at right. Discuss this model with your team. Which part of the model represents Rimshot getting one point How can you use the model to help calculate the probability that Rimshot will get exactly one point (0.7)(0.3) = 21% Use either your tree diagram or the area model to help you calculate the probabilities that Rimshot will get either zero or two points. What is the most likely of the three outcomes 2 points: (0.7)(0.7) = 49% 0 points: 30%")
12
3-27. With your team, examine the probability area model from problem 3-26.
What are the dimensions of the large rectangle? Explain why these dimensions make sense. 1 unit by 1 unit; Each dimension represents probabilities of all of the possible outcomes of one of the two events. The sum of all of the outcomes should always be 1. What is the total area of the model? Express the area as a product of the dimensions and as a sum of the parts. 1 square unit (0.3 + 0.7)(0.3 + 0.7) = (0.7)(0.7) + (0.7) (0.3) + 1(0.3) What events and probabilities are represented by the entire area model? The probability that Rimshot will score 0, 1, or 2 points.
( ) = (0.7)(0.7) + (0.7) (0.3) + 1(0.3) What events and probabilities are represented by the entire area model The probability that Rimshot will score 0, 1, or 2 points.")
13
3-28 Learning Log: Using Probability Models
Systematic lists Outcomes are equally likely Probability area models Two probabilistic situations Events are independent Tree diagrams Two or more situations Independent or non-independent events Tree diagrams can be the most versatile, but they can be tedious if there are many branches.

Similar presentations


 Is the likelihood or chance of an even occurring.>")


