Download presentation
Presentation is loading. Please wait.

1
Graphing Linear Inequalities in Two Variables A solution to a linear inequality is a point (x, y) that makes the inequality true. The solution set includes all of these points.

2
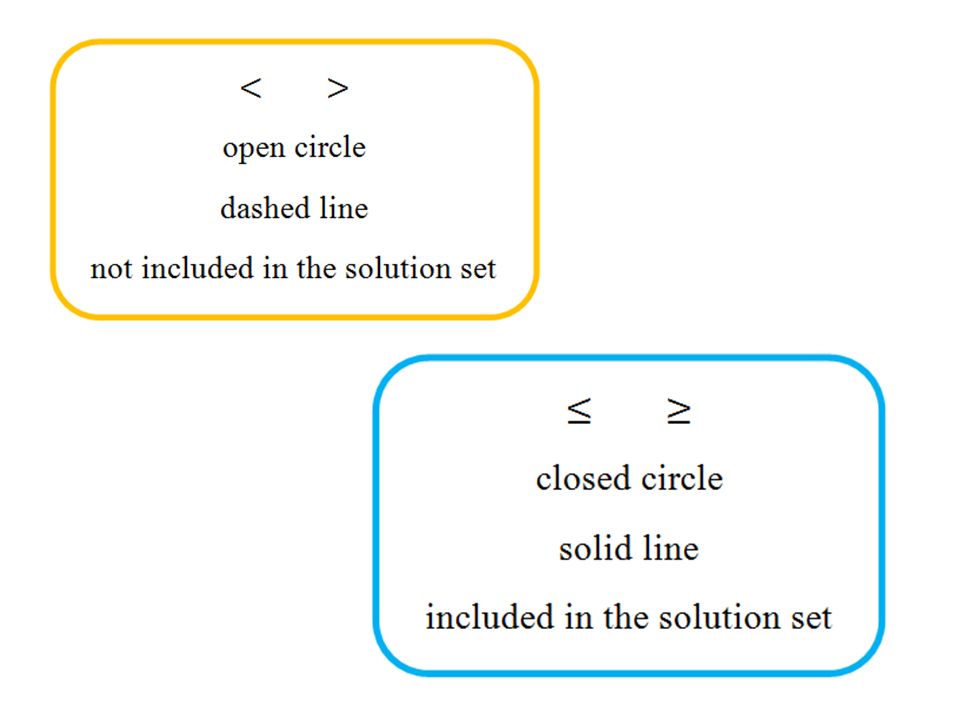
Key Idea: The graph of an inequality in two variables shows all of the solutions of the inequality on a coordinate plane. The boundary line divides the coordinate plane into two half-planes. A dashed boundary line means that the solution set does not contain the points on the line. A solid boundary line means that it does. The graph is shaded to indicate which half plane is included in the solution set.

4
Example #1 Graph y > 2x + 1

5
Example #2 Graph y ≤ -2

6
Example #3 Graph

7
Example #4 Graph

Similar presentations


 y < – 3 and ( b ) x < 2 in a coordinate plane. Test the point (0,0). Because (0,0) is.>")
 y < –3 and ( b ) x < 2 in a coordinate plane. Test the point (0,0). Because (0,0) is.>")

Graph the related linear equality (forms the boundary line). and are graphed.>")


