Download presentation
Presentation is loading. Please wait.

1
Neural Networks

2
Molecules Levels of Information Processing in the Nervous System 0.01 m Synapses 1m1m Neurons 100 m Local Networks 1mm Areas / „Maps“ 1cm Sub-Systems 10cm CNS 1m

5
3) determine motion and sound perceptions
 determine motion and sound perceptions")
6
Sound coming from a particular location in space reaches the two ears at different times. From the interaural time difference the azimuth of the sound direction can be estimated. Example: Interaural Time Difference (ITD):
:.")
7
Each neuron receives input from both ears. Due to the lengths of the two axons, the inputs arrive at different times. The neuron acts as a „coincidence detector“ and only fires if two spikes arrive at the same time. Delay line correlator: => Each neuron encodes a specific interaural time difference.

8
Delay lines in the owl brain: Ear -> Auditory nerve -> NM -> NL -> LS -> ICx Input Coincidence detector

9
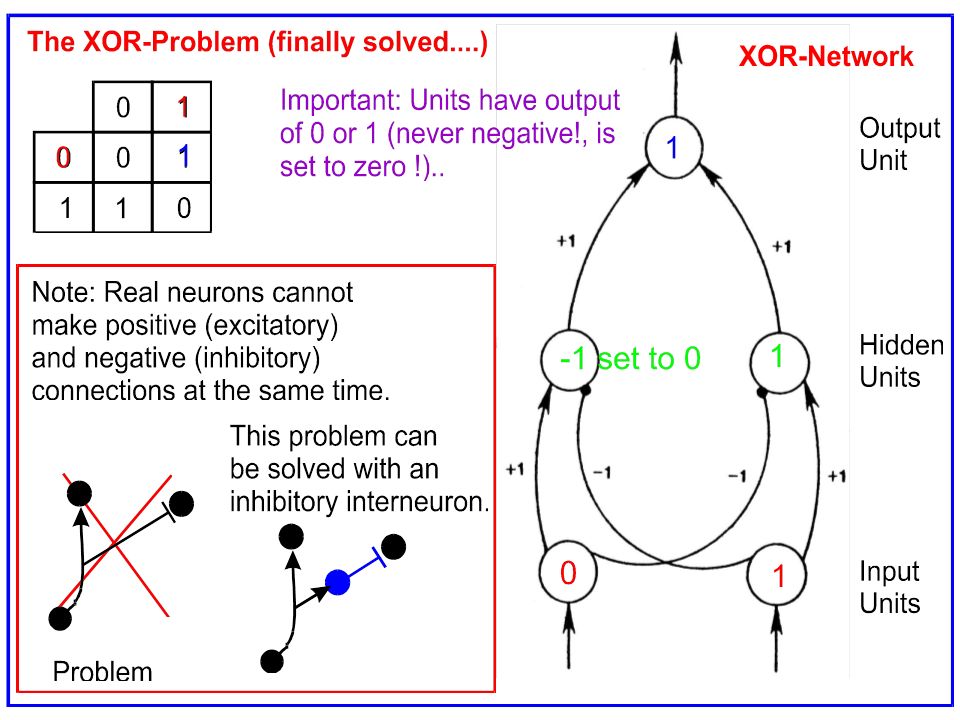
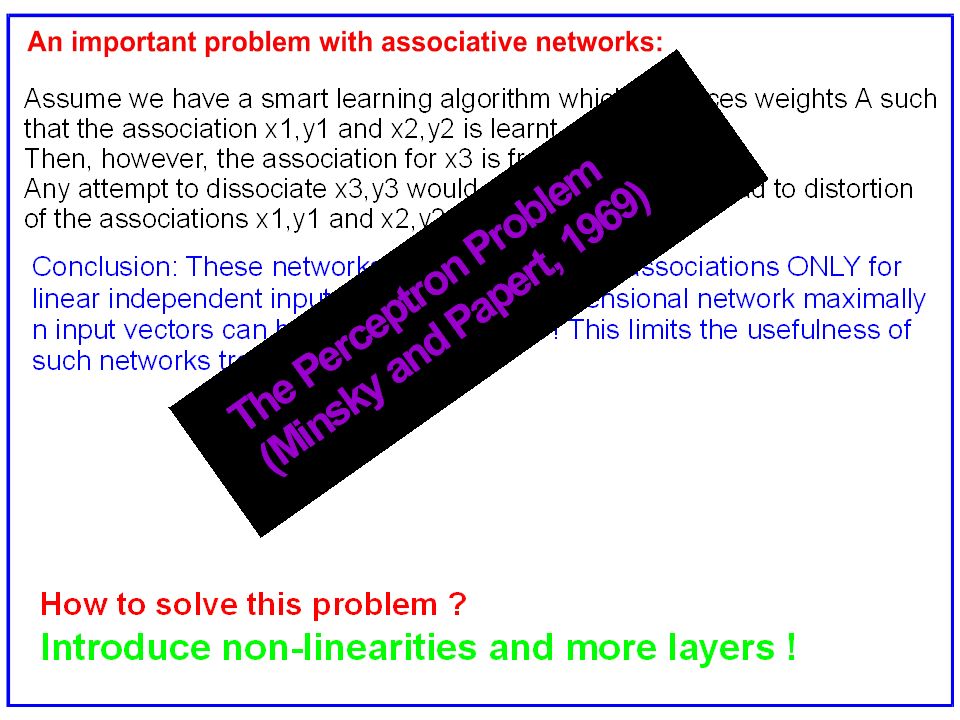
Back to an old problem

11
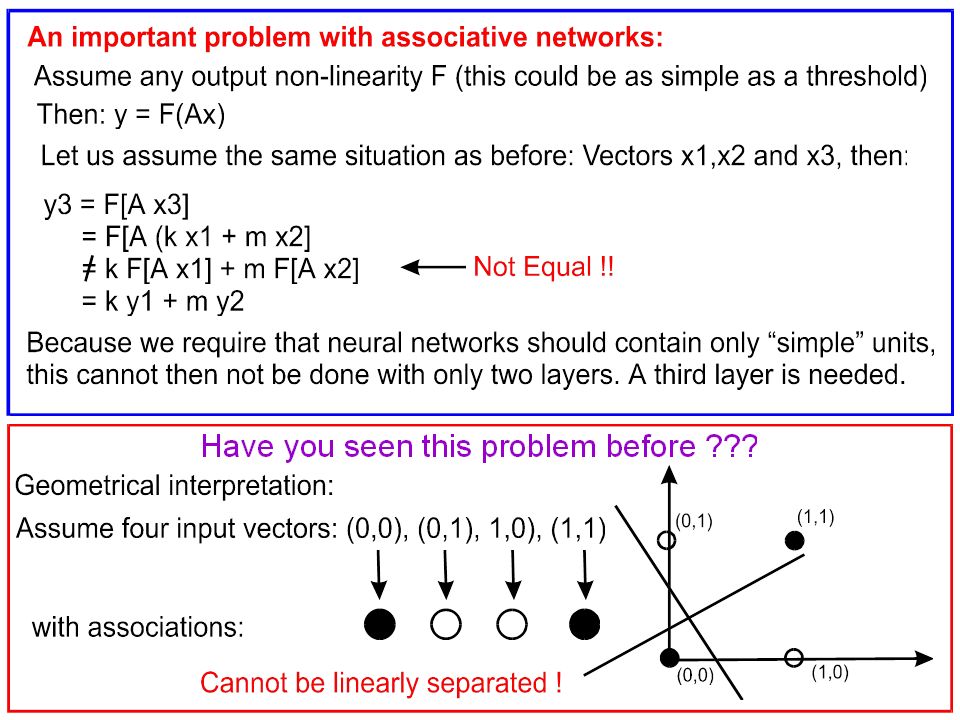
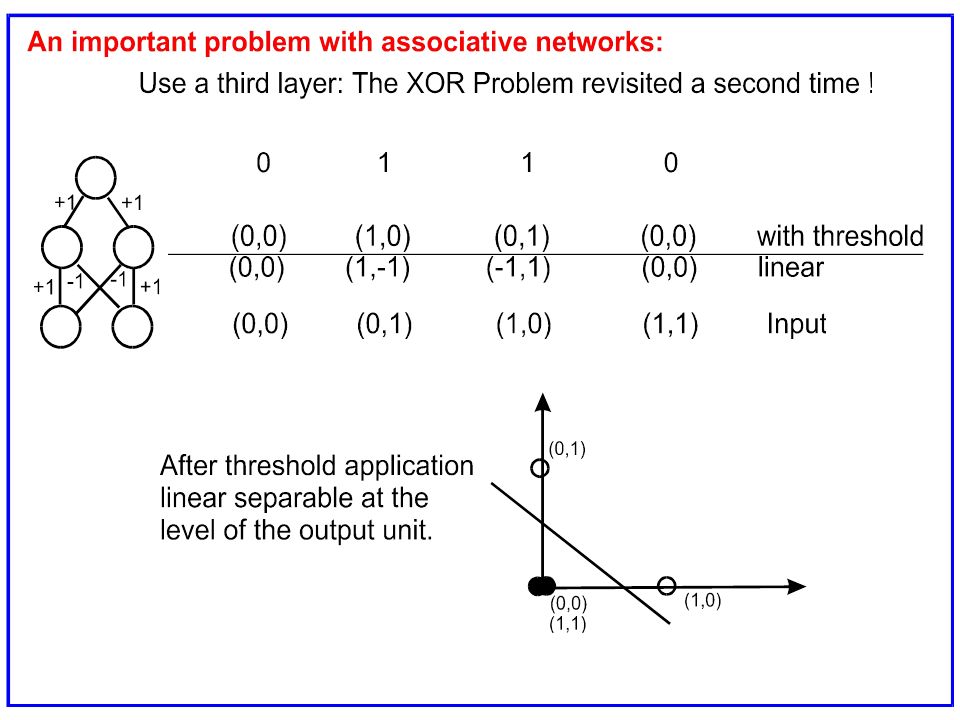
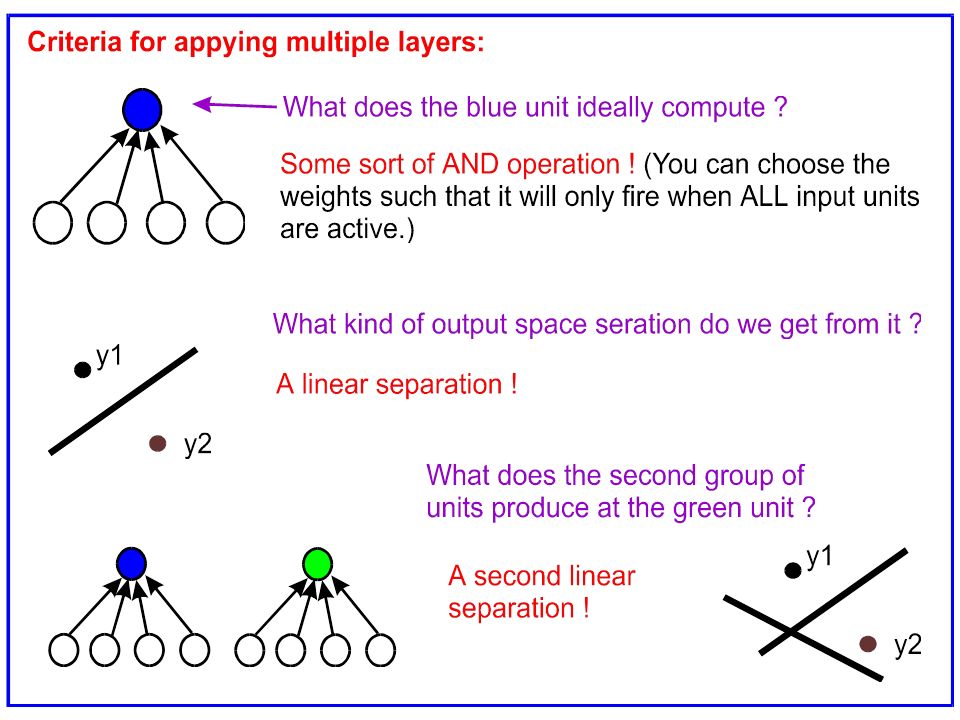
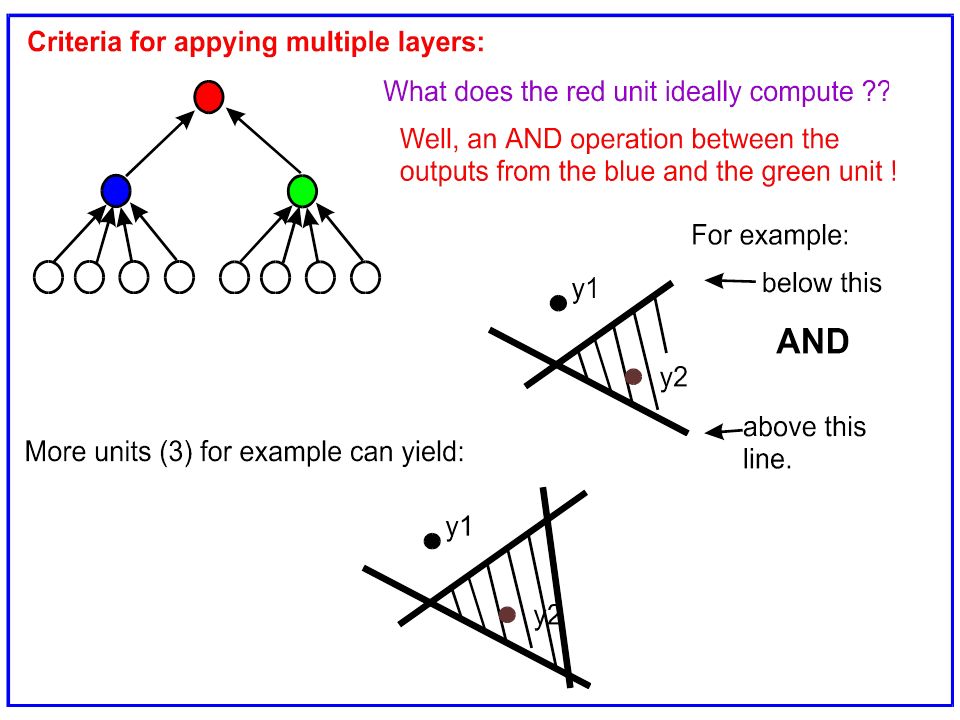
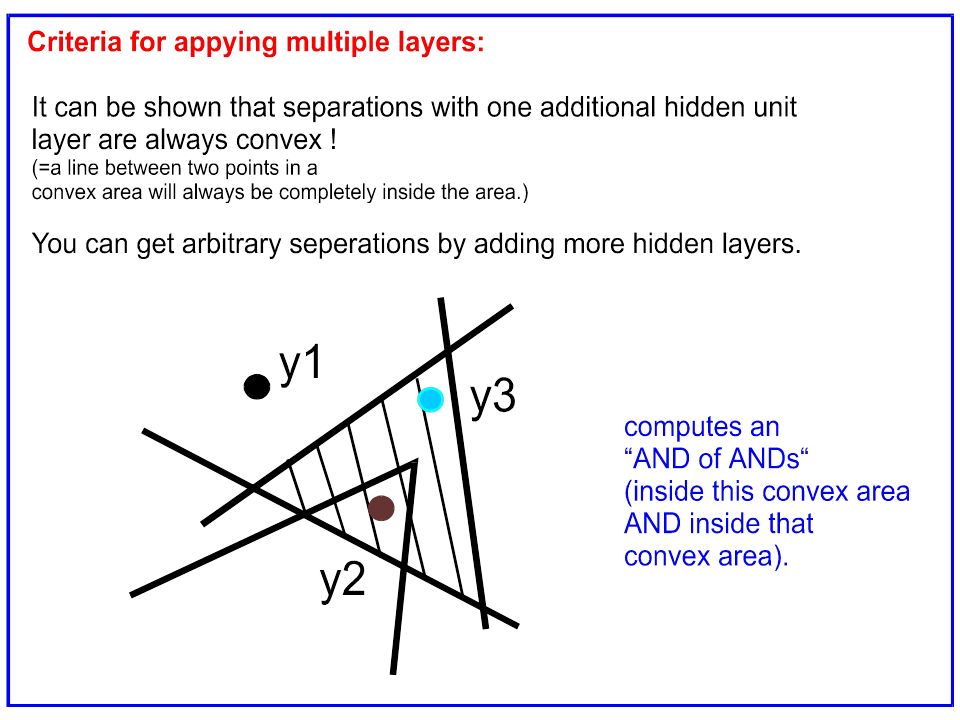
But the basic problem is not solved (A=0 -> A’=1)
")
13
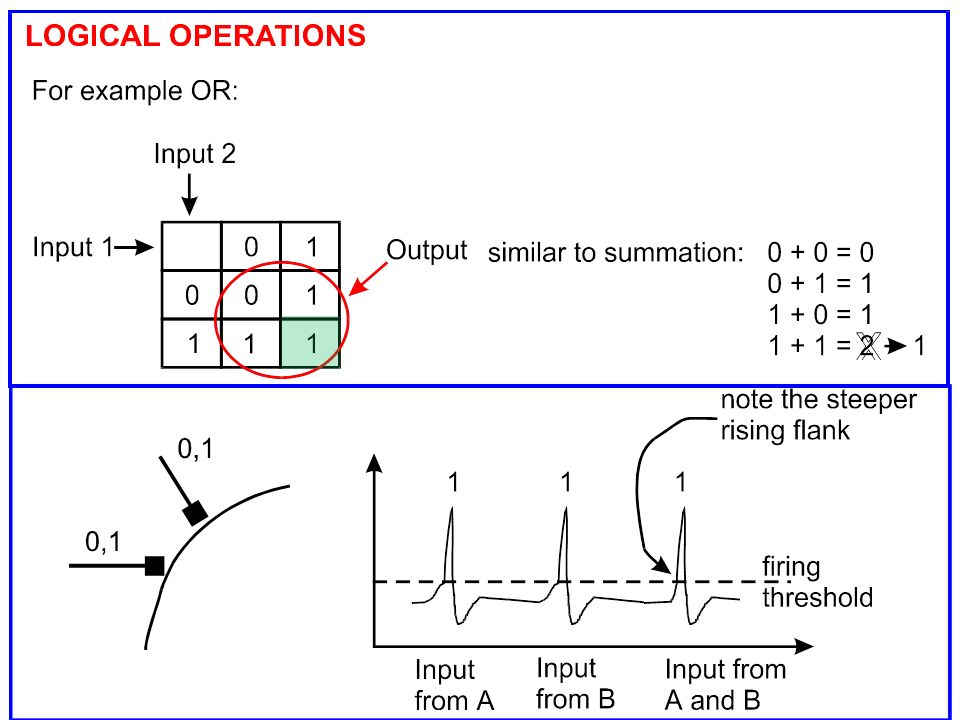
What else can we do with networks of neurons? But… so far we only considered excitatory and inhibitory synapses with the same strength (+1, -1). Are other values possible? What determines the synaptic strength? different EPSP amplitudes
. Are other values possible. What determines the synaptic strength. different EPSP amplitudes.")
14
Receptor ≈ Channel Vesicle Transmitter Axon Dendrite Schematic Diagram of a Synapse:

15
Senn, Markram, and Tsodyks, 2000 Release Probability of Neurotransmitters In a network we have maaany synapses… too complicated!!! Second messengers Receptors

16
Receptor ≈ Channel Vesicle Transmitter Axon Dendrite Schematic Diagram of a Synapse: Transmitter, Receptors, Vesicles, Channels, etc. synaptic weight:

31
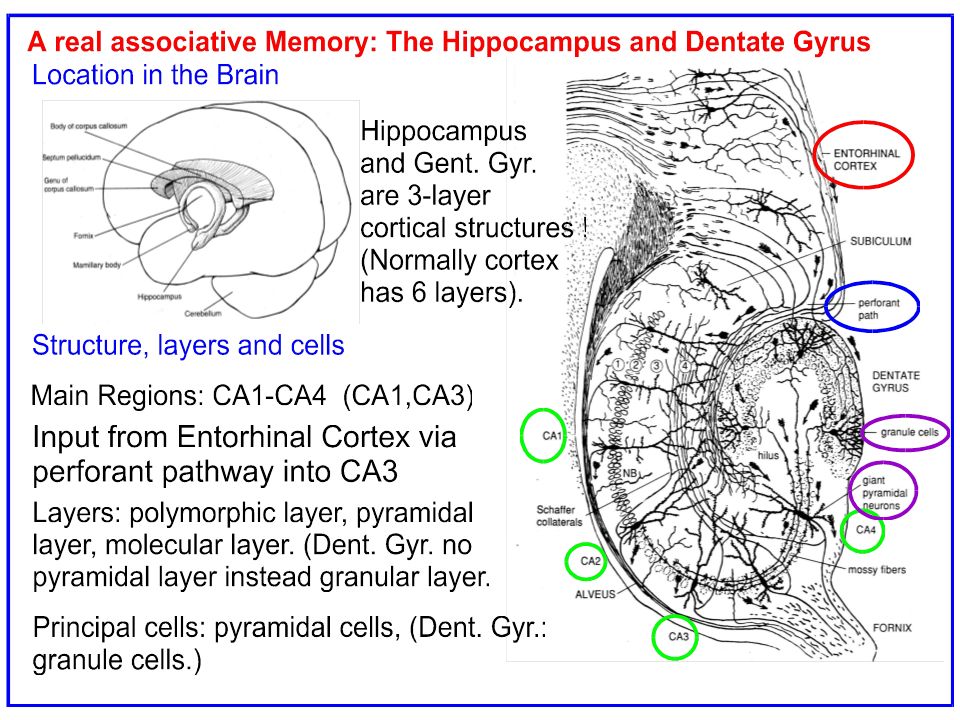
perforant pathway mossy fiber Schaffer collaterals

32
in the CA3

33
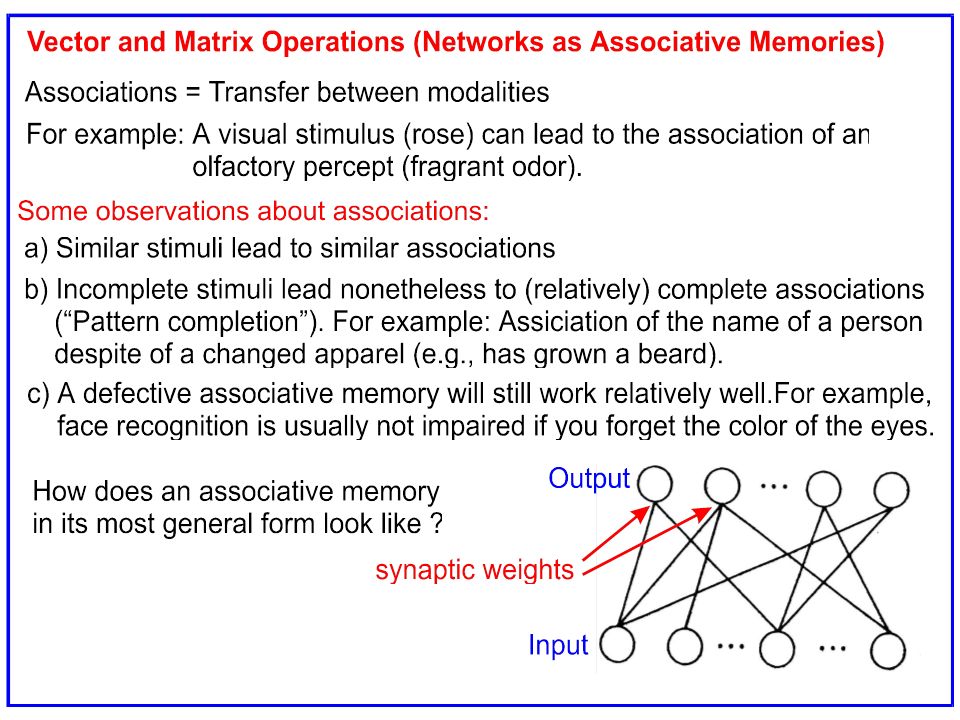
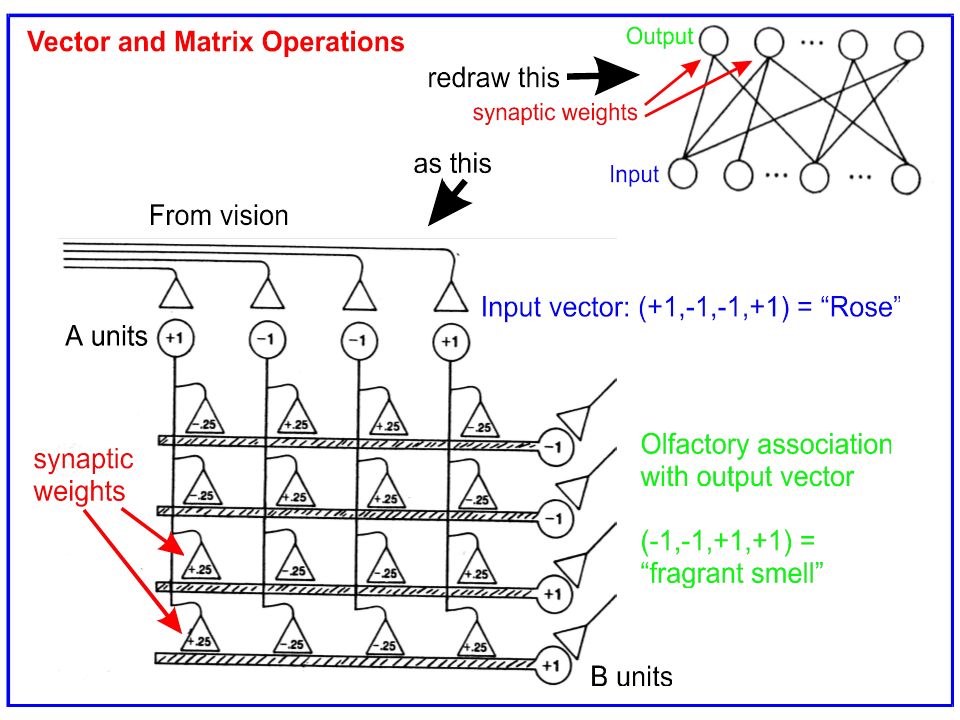
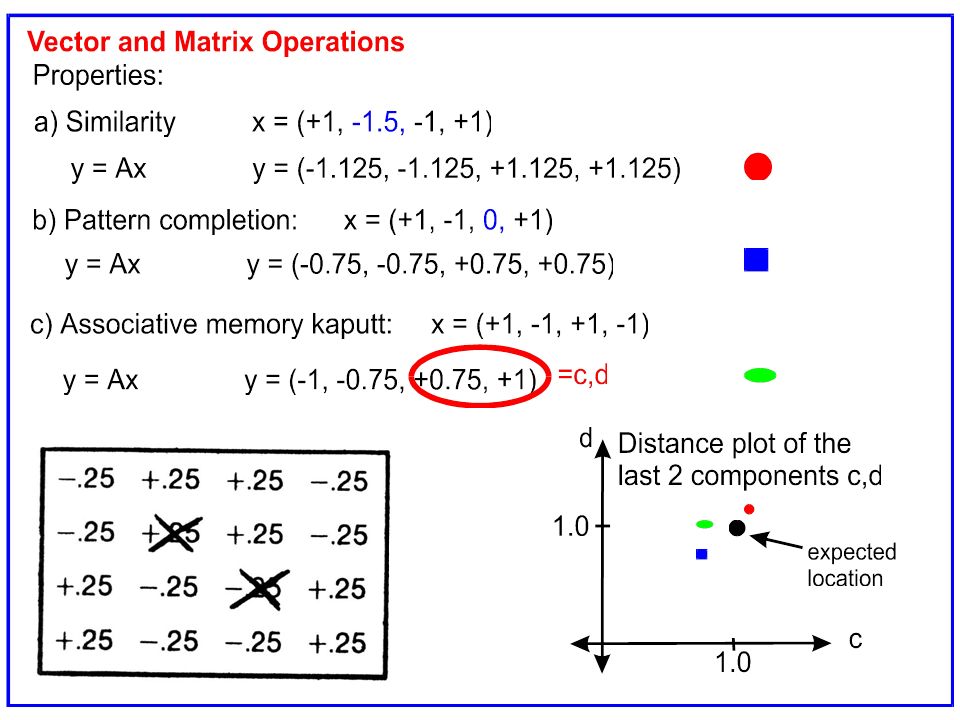
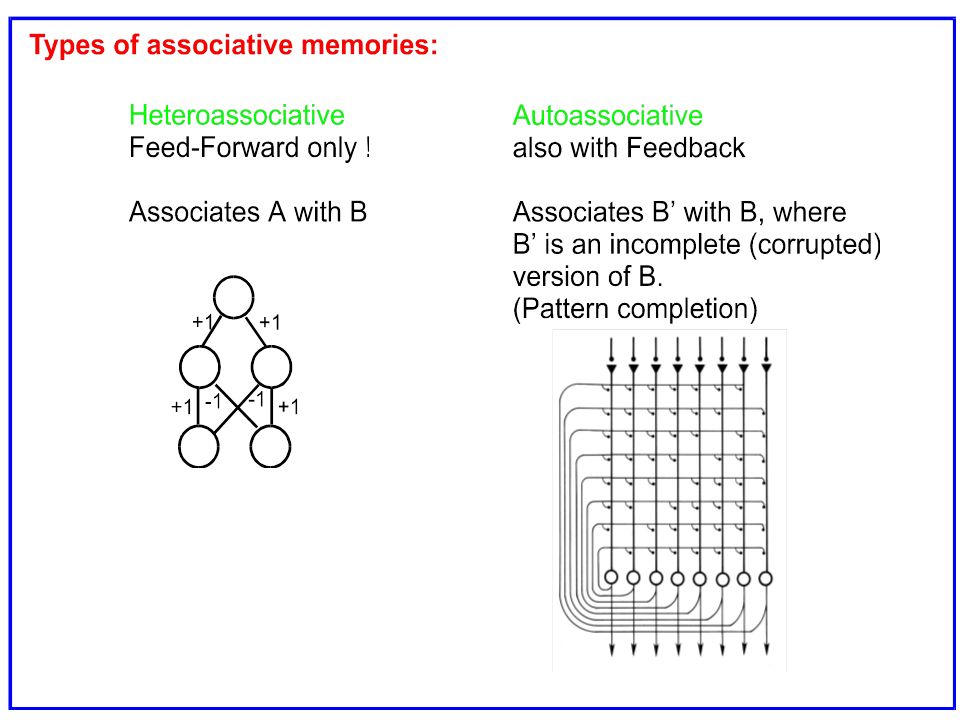
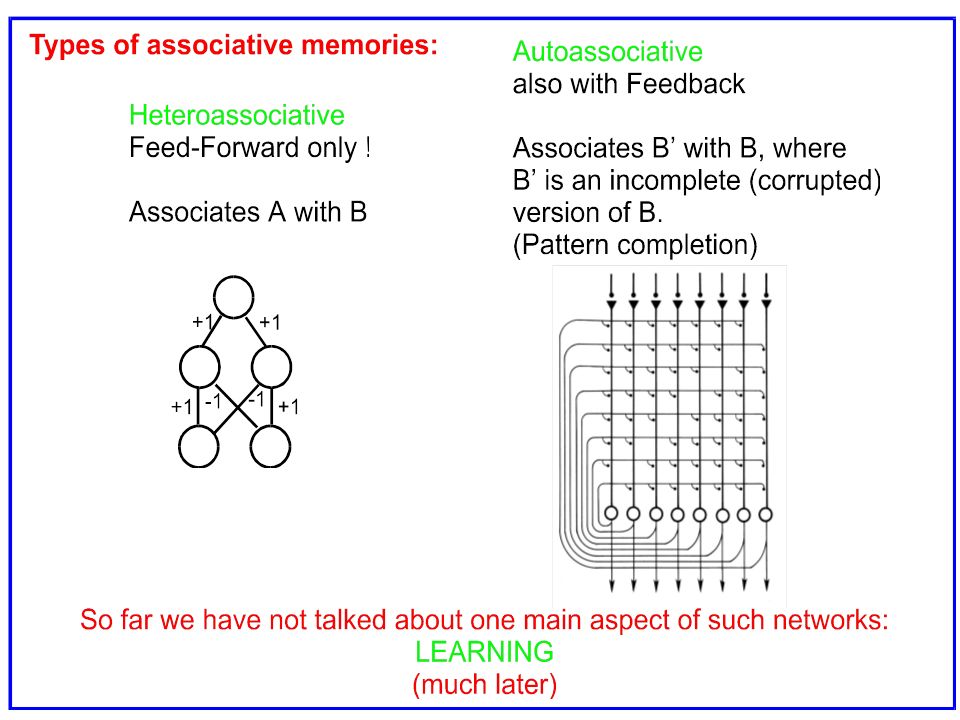
time Input Recurrent Activity 1 Recurrent Activity 2 Recurrent Activity 3 Recurrent Activity n=n-1 Output … How does an associative memory work?

34
Associative Memory: Simple Example The input yields following initial recurrent activity: another example firing threshold synaptic weight spike no spike

35
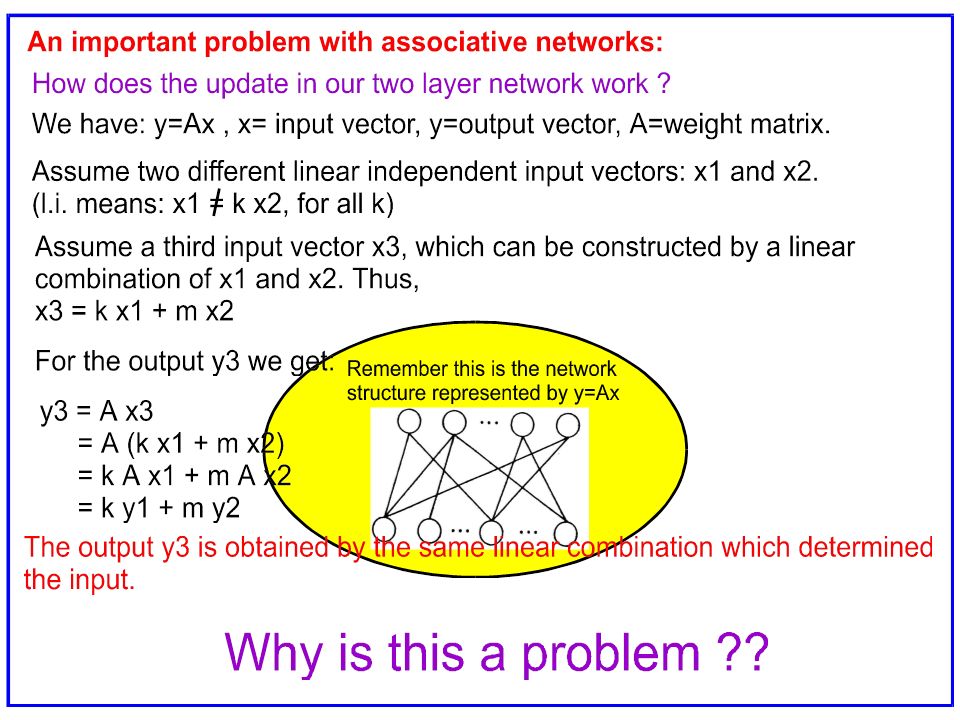
Associative Memory: Simple Example Energy: Associative memory of this network The stable state is determined by the connections in A. Thus, a certain pattern can be learned by changing A accordingly. → Learning

37
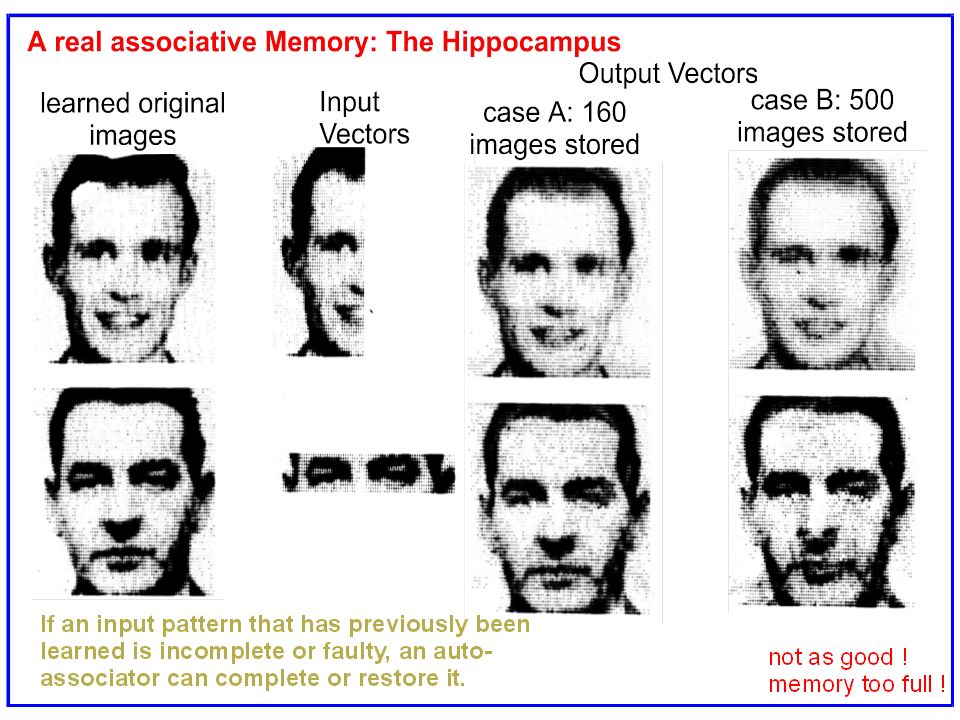
stable region (and energy of patterns is lower than energy of spurious states) stable region (but energy of patterns is higher than energy of spurious states) unstable region (pattern states are unstable) Associative Memory: statistical physics How many patterns can we store? noise number of patterns number of neurons A network of 1000 neurons can store 138 patterns.

Similar presentations


 - made.>")


