Download presentation
Presentation is loading. Please wait.

2
19 Economic Inequality

3
After studying this chapter you will be able to Describe the inequality in income and wealth in Canada in 2009 and the trends in economic inequality Describe the distribution of income and the trends in inequality in selected countries and the world Explain the sources of economic inequality and its trends Describe the scale of government income redistribution in Canada Copyright © 2013 Pearson Canada Inc., Toronto, Ontario

4
Every night, around 2,500 people sleep outside without shelter in Vancouver, a city with mansions that are home to some of the wealthiest Canadians. In Toronto, where Isadore Sharp is building a luxury apartment tower with a penthouse priced at $30 million, more than 5,000 people seek a bed every night in a shelter for the homeless. Extreme poverty and extreme wealth exist side by side in every major city in Canada and in most parts of the world. What are the sources of poverty? What can the government do to make poverty less extreme? Copyright © 2013 Pearson Canada Inc., Toronto, Ontario

5
Statistics Canada provides a measure of economic inequality based on three definitions of income Market income equals wages, interest, rent, and profit earned in factor markets before paying income taxes. Total income equals market income plus cash payments to households by governments. After-tax income equals total income minus tax payments by households to governments. Measuring Economic Inequality Copyright © 2013 Pearson Canada Inc., Toronto, Ontario

6
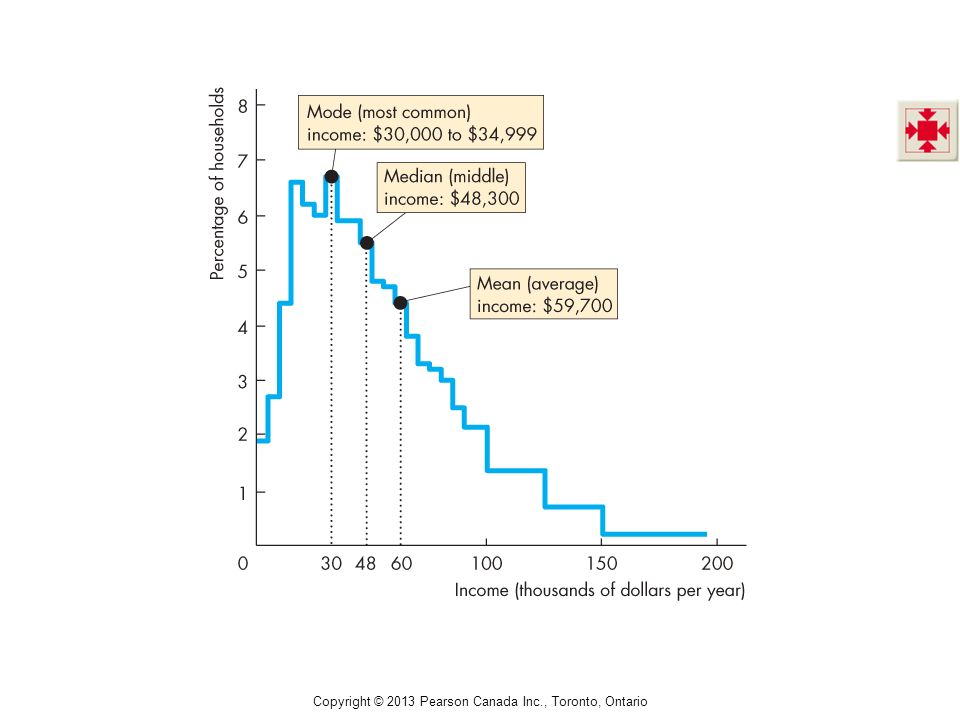
Measuring Economic Inequality The Distribution of Income Figure 19.1 shows the distribution of after-tax income across the 14.3 million households in Canada in 2009. Copyright © 2013 Pearson Canada Inc., Toronto, Ontario

8
The mode income is the most common income and was between $30,000 and $34,999. The median income is the middle-level of income and was $48,300. The mean income is the average income and was $59,700. Measuring Economic Inequality Copyright © 2013 Pearson Canada Inc., Toronto, Ontario

9
A distribution in which the mean exceeds the median and the median exceeds the mode is positively skewed, which means it has a long tail of high values. The distribution of income in Canada is positively skewed. Measuring Economic Inequality Copyright © 2013 Pearson Canada Inc., Toronto, Ontario

10
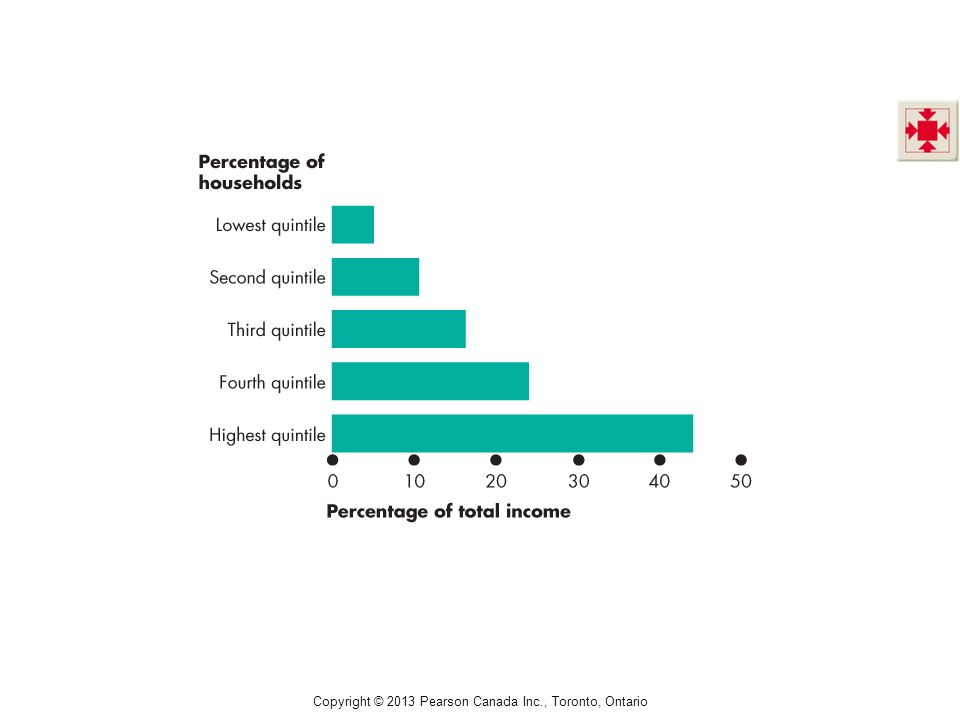
Measuring Economic Inequality Figure 19.2 shows the distribution of quintile shares of income for Canada in 2009. Copyright © 2013 Pearson Canada Inc., Toronto, Ontario

12
In 2009: The poorest 20% of households received only 4.9% of the total after-tax income. The middle 20% received 16.3% of total after-tax income. The richest 20% received 44.2% of total after-tax income. Measuring Economic Inequality Copyright © 2013 Pearson Canada Inc., Toronto, Ontario

13
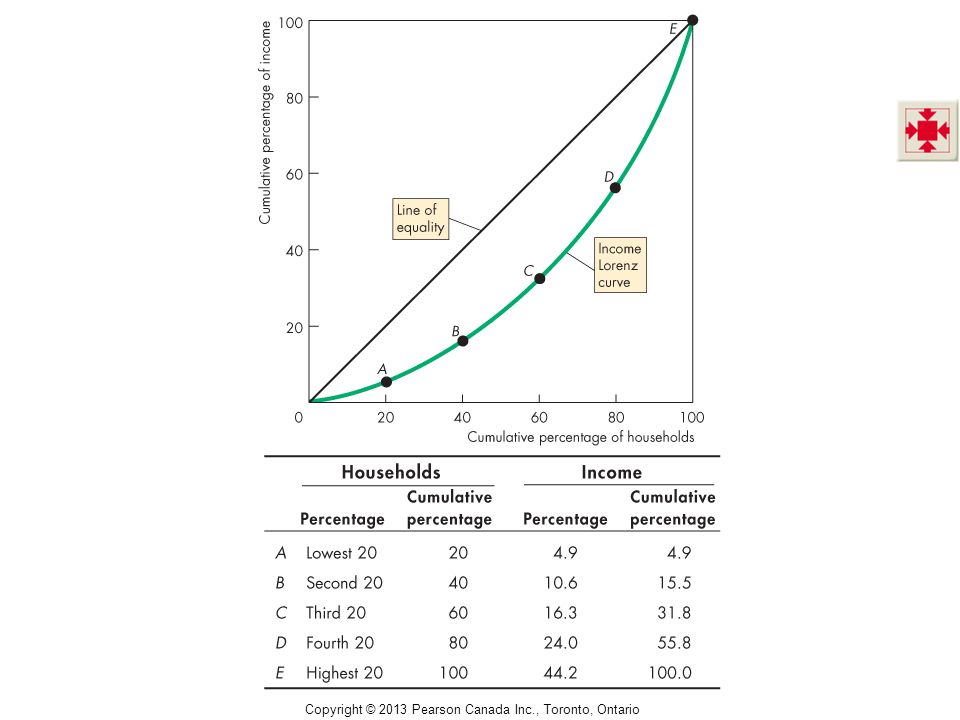
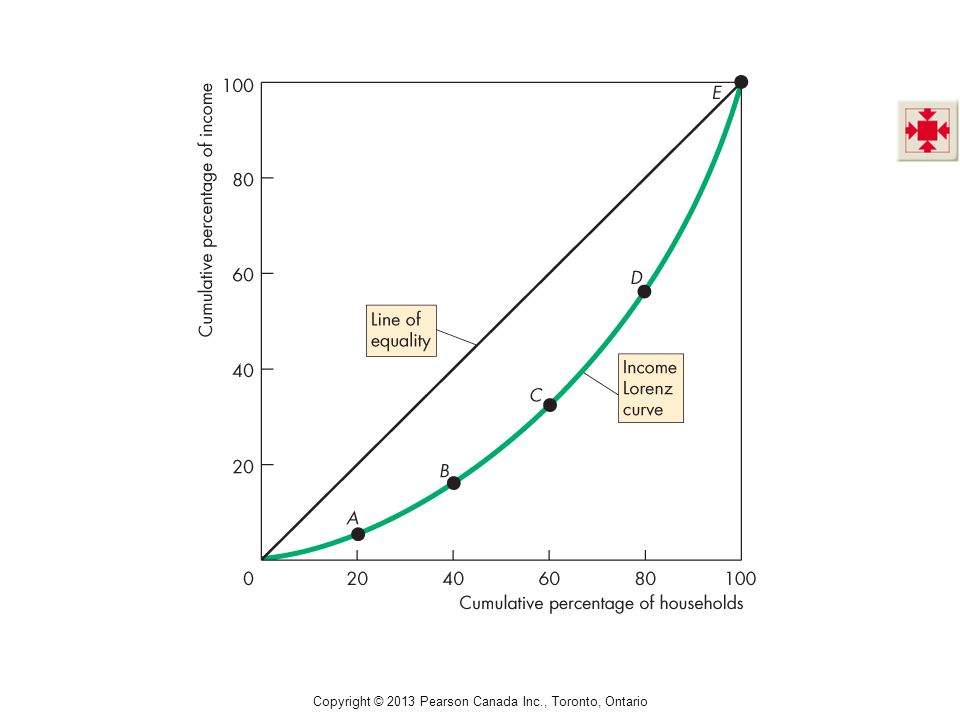
Measuring Economic Inequality The Income Lorenz Curve The income Lorenz curve graphs the cumulative percentage of income earned against the cumulative percentage of households. Copyright © 2013 Pearson Canada Inc., Toronto, Ontario

14
The vertical axis plots the cumulative percentage of income. The horizontal axis is the cumulative percentage of households. Measuring Economic Inequality Copyright © 2013 Pearson Canada Inc., Toronto, Ontario

16
Measuring Economic Inequality If everyone has the same income, … the income Lorenz curve is a 45 degree line from the lower left corner to the upper right corner. This line is called the line of equality. The Lorenz curve shows the distribution of income. Copyright © 2013 Pearson Canada Inc., Toronto, Ontario

18
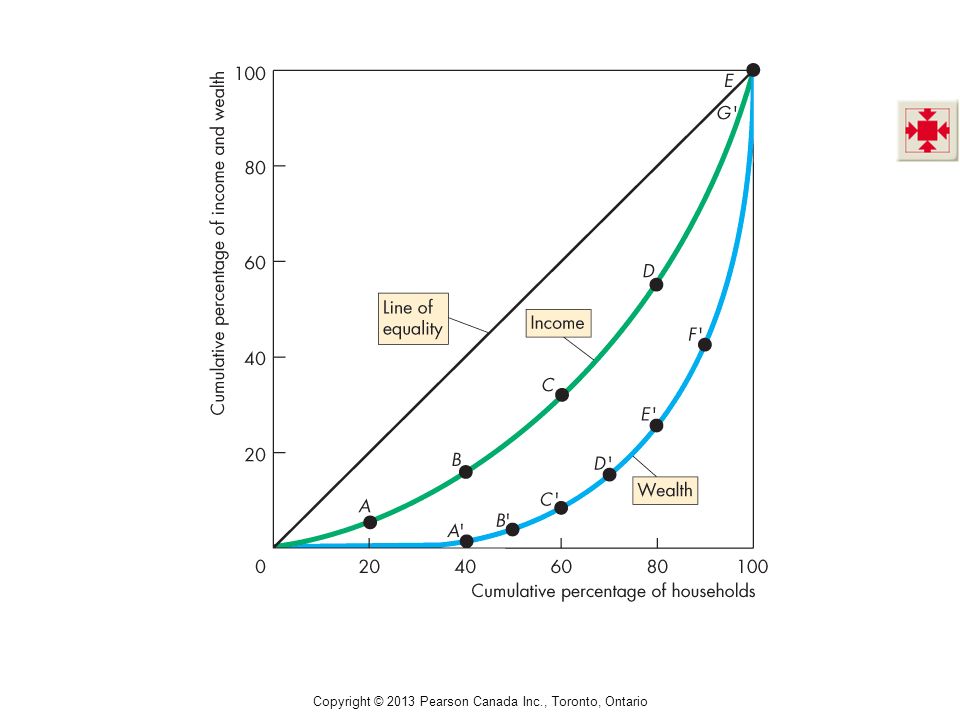
The Distribution of Wealth A household’s wealth is the value of all the things that it owns at a point in time. The distribution of wealth is another way of examining the degree of economic inequality. Measuring Economic Inequality Copyright © 2013 Pearson Canada Inc., Toronto, Ontario

20
A wealth Lorenz curve measures the distribution of wealth. The distribution of wealth is even more unequally distributed than income. Measuring Economic Inequality Copyright © 2013 Pearson Canada Inc., Toronto, Ontario

21
Wealth or Income? Wealth is a stock of assets and income is a flow of earnings that result from a given stock of wealth. Wealth is more unequally distributed than income because wealth does not measure the quantity of human capital. Income reflects the quantity of human capital. Because the distribution of wealth excludes human capital, the distribution of income is a more accurate measure of economic inequality. Measuring Economic Inequality Copyright © 2013 Pearson Canada Inc., Toronto, Ontario

22
Annual or Lifetime Income and Wealth? A household’s income and wealth change over time. A household headed by a young person starts out with moderate income and accumulates wealth for retirement years. A middle-age headed household is in its highest income years and enjoys the highest level of wealth. A households headed by an older, retired person has lower income and is consuming, rather than accumulating, its wealth. Measuring Economic Inequality Copyright © 2013 Pearson Canada Inc., Toronto, Ontario

23
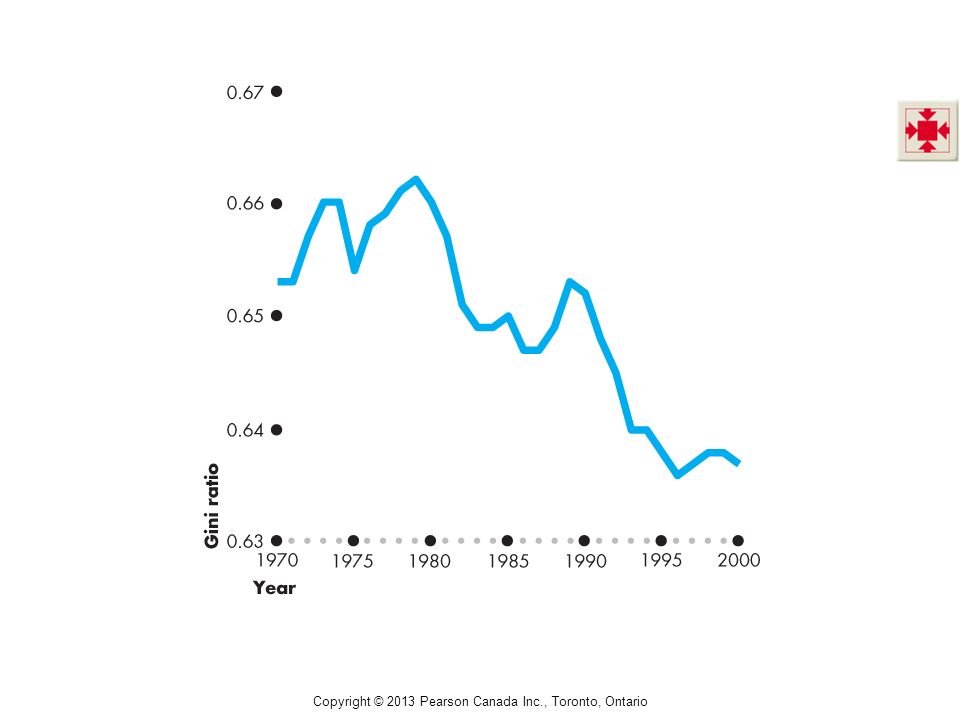
Trends in Inequality To measure inequality as an index number, we use the Gini coefficient, which equals the ratio of blue area to the red area in the two figures below. Measuring Economic Inequality Copyright © 2013 Pearson Canada Inc., Toronto, Ontario

24
With perfect equality, the Lorenz curve is the line of equality and the Gini coefficient is zero. Measuring Economic Inequality Copyright © 2013 Pearson Canada Inc., Toronto, Ontario

25
With the most extreme inequality—one person has all the income—the Lorenz curve runs along the axes and the Gini coefficient is one. Measuring Economic Inequality Copyright © 2013 Pearson Canada Inc., Toronto, Ontario

26
The closer the Gini coefficient is to one, the more unequal is the distribution of income. In 2009, the Canadian Gini coefficient was 0.45. Measuring Economic Inequality Copyright © 2013 Pearson Canada Inc., Toronto, Ontario

27
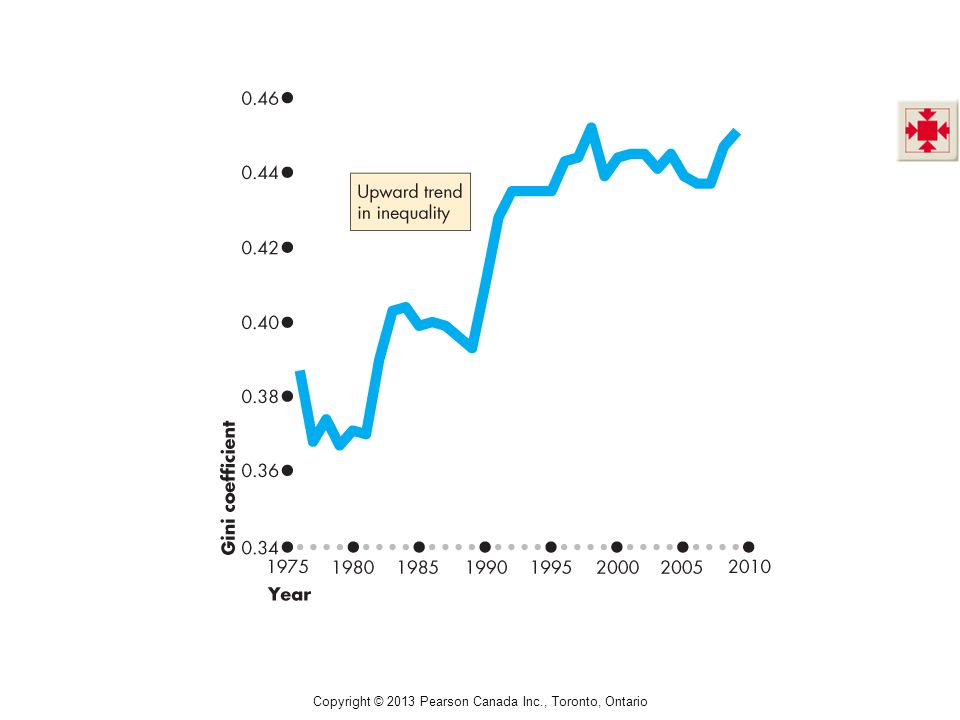
Figure 19.5 shows the Canadian Gini coefficient from 1976 to 2009. The Gini coefficient shows that the distribution of income in Canada become more unequal from 1976 to 2009. Most of the increase occurred during the 1990s. Measuring Economic Inequality Copyright © 2013 Pearson Canada Inc., Toronto, Ontario

29
Poverty Poverty is a situation in which a household’s income is too low to be able to buy the quantities of food, shelter, and clothing that are deemed necessary. Poverty is a relative concept. In Canada, poverty is identified in relative terms using the concept of the low-income cut-off. Low-income cut-off is defined as the income level below which a family normally spends 63.6 percent or more of its income on food, shelter, and clothing. Measuring Economic Inequality Copyright © 2013 Pearson Canada Inc., Toronto, Ontario

30
Measuring Economic Inequality Figure 19.6 shows the incidence of low income. The incidence of low income in Canada has fluctuated between 14 and 20 percent of families. On average, 17 percent of families are below the low-income cut-off. Copyright © 2013 Pearson Canada Inc., Toronto, Ontario

32
Inequality in the World Economy Which countries have the greatest economic inequality? Which countries have the least and the greatest equality? Where does Canada rank? How much inequality is there in the world economy as a whole? Copyright © 2013 Pearson Canada Inc., Toronto, Ontario

33
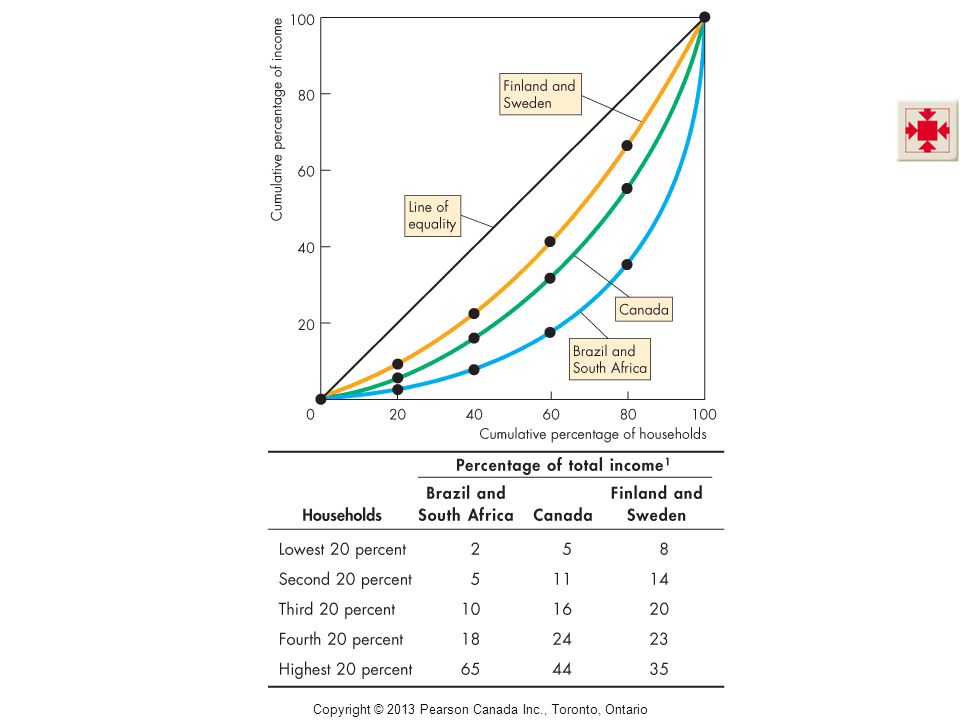
Inequality in the World Economy Income Distributions in Selected Countries Figure 19.7 illustrates some extremes and the Canadian Lorenz curves. Copyright © 2013 Pearson Canada Inc., Toronto, Ontario

35
Inequality in the World Economy Global Inequality and Its Trends The global distribution of income is much more unequal than the distribution within any one country. Of the world population: 50 percent live on $2.50 a day or less; 30 percent live on between $2.50 and $10 a day. That is, 80 percent of the world population is very poor. The average Canadian has $164 a day. Copyright © 2013 Pearson Canada Inc., Toronto, Ontario

36
Inequality in the World Economy World Gini Ratio The global distribution of income is becoming less unequal. Despite individual countries are becoming more unequal, incomes in poorer countries are rising faster than incomes in rich countries. Copyright © 2013 Pearson Canada Inc., Toronto, Ontario

38
The Sources of Economic Inequality Inequality arises from unequal labour market outcomes and from unequal ownership of capital. Three significant features of labour markets contribute to income differences among individuals: Human capital Discrimination Contest among superstars Copyright © 2013 Pearson Canada Inc., Toronto, Ontario

39
Human Capital The more human capital a person possesses, the more income that person likely earns, other things remaining the same. On the demand side of the labour market, high-skilled workers generate a larger value of marginal product than low-skilled workers. So firms are willing to pay a higher wage rate for high- skilled labour. The Sources of Economic Inequality Copyright © 2013 Pearson Canada Inc., Toronto, Ontario

40
On the supply side of the labour market, high-skilled workers incur a cost of acquiring their skills—money costs as well as time costs. So high-skilled workers are willing to supply labour only at wage rates that compensate them for those costs. The supply of high-skilled workers is smaller than the supply of low-skilled workers. The Sources of Economic Inequality Copyright © 2013 Pearson Canada Inc., Toronto, Ontario

41
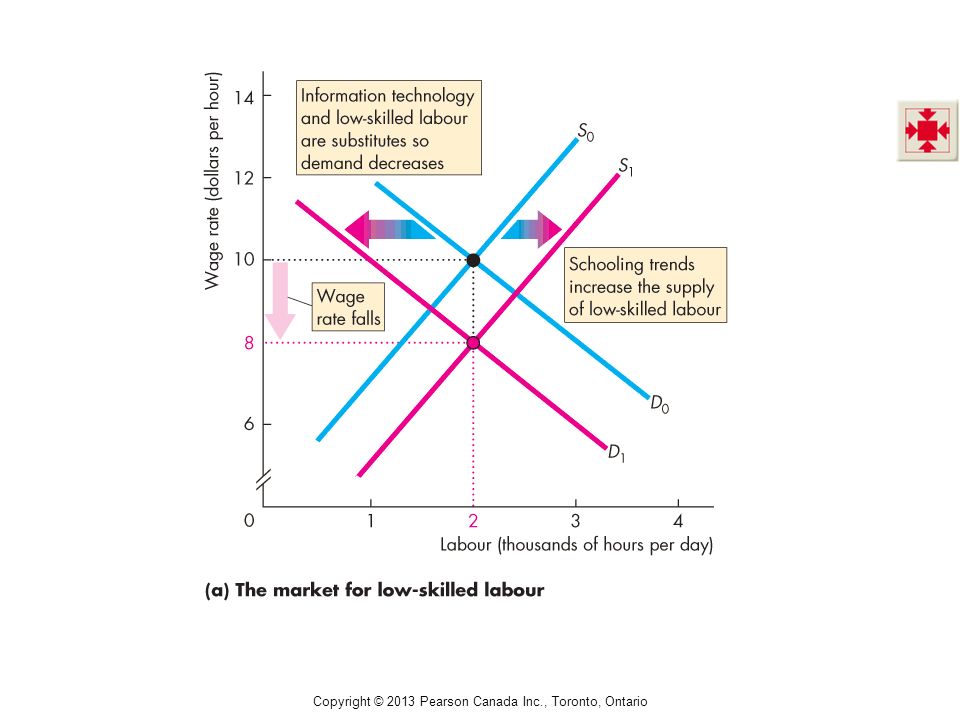
Trends in Inequality Explained … Technology and Education New technology and low- skilled labour are substitutes, so the demand for low-skilled labour has decreased. Trends in schooling have increased the supply of low- skilled labour. The wage rate has fallen. The Sources of Economic Inequality Copyright © 2013 Pearson Canada Inc., Toronto, Ontario

43
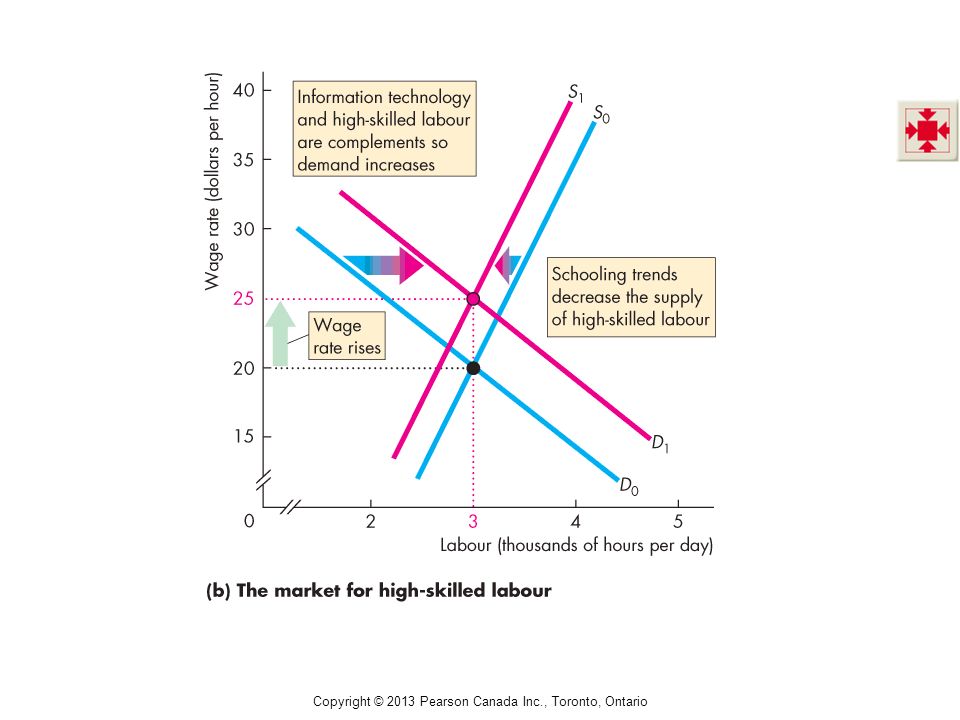
New technologies and high- skilled labour are complements, and the demand for high-skilled labour has increased. Trends in schooling have lowered the growth rate of the supply of high-skilled labour. The wage rate has risen. The Sources of Economic Inequality Copyright © 2013 Pearson Canada Inc., Toronto, Ontario

45
The Sources of Economic Inequality The gap between the wage rates of high-skilled and low- skilled labour has increased. Copyright © 2013 Pearson Canada Inc., Toronto, Ontario

46
Discrimination Human capital differences can explain some of the economic inequality we observe. Discrimination is another possible source of income inequality. If the value of marginal product of one sex is perceived to be higher than that of another sex, the equilibrium wage rates will vary across the gender groups, despite holding human capital constant. The Sources of Economic Inequality Copyright © 2013 Pearson Canada Inc., Toronto, Ontario

47
Suppose that firms perceive males to be more productive workers than females. Then the perceived value of marginal product of men would be higher than that of women. The demand for labour of men is higher than the demand for labour of women. The Sources of Economic Inequality Copyright © 2013 Pearson Canada Inc., Toronto, Ontario

48
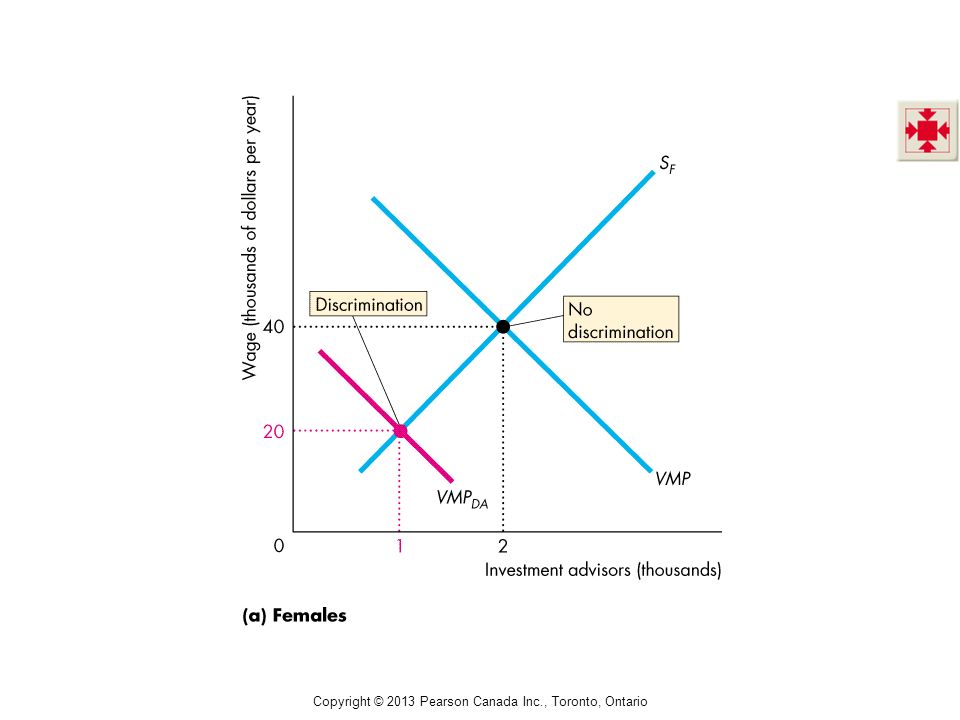
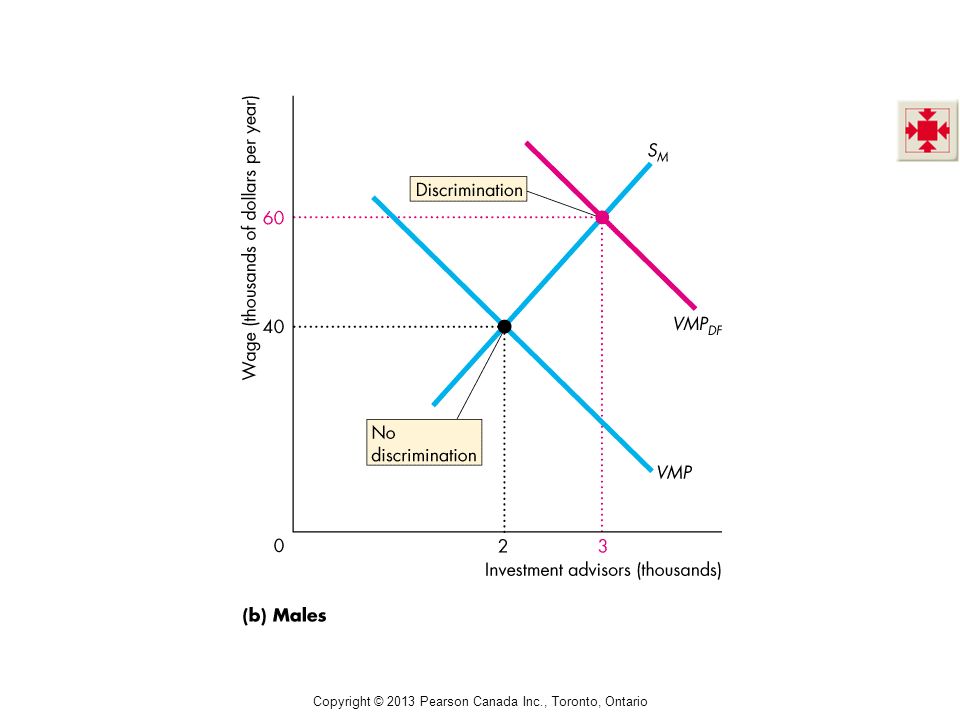
Figure 19.10 shows the potential effect of discrimination between men and women. If women are discriminated against, the perceived VMP is lower. Their wage rate and employment level decrease. The Sources of Economic Inequality Copyright © 2013 Pearson Canada Inc., Toronto, Ontario

50
If men are discriminated in favour, the perceived VMP is higher. Their wage rate and employment level increase. The Sources of Economic Inequality Copyright © 2013 Pearson Canada Inc., Toronto, Ontario

52
Counteracting Forces Economists disagree to the extent that discrimination pervades the labour market. One line of reasoning states: Firms that discriminate would have higher production costs (pay higher wages for the same VMP) than those that do not. If this line of reasoning is correct, firms practising discrimination will have 1. Smaller profits margins. 2. Higher market prices. The Sources of Economic Inequality Copyright © 2013 Pearson Canada Inc., Toronto, Ontario
 than those that do not. If this line of reasoning is correct, firms practising discrimination will have 1. Smaller profits margins. 2. Higher market prices. The Sources of Economic Inequality Copyright © 2013 Pearson Canada Inc., Toronto, Ontario.")
53
Either way, market pressures increase the opportunity cost to firms for practising discrimination, eventually eliminating these practices. Differences in the Degree of Specialization Another line of reasoning is that: sex discrimination can be explained by differences between the men and women regarding their willingness, on average, to specialize in earning a wage versus doing jobs in the home. The Sources of Economic Inequality Copyright © 2013 Pearson Canada Inc., Toronto, Ontario

54
More women than men work at home for a portion of their adult life while engaged in child rearing and/or running the household. This allocation of time means that women’s wages will be lower, on average, than men’s wages. Accounting for this difference in labour specialization has been found to explain much of the wage differentials between men and women. The Sources of Economic Inequality Copyright © 2013 Pearson Canada Inc., Toronto, Ontario

55
Contests Among Superstars Contests among superstars can explain large differences in incomes. Globalization has increased the market reach of the winner in a winner-take-all contest and increased the spread between the winner and the runner up. The Sources of Economic Inequality Copyright © 2013 Pearson Canada Inc., Toronto, Ontario

56
Unequal Wealth The inequality of wealth (excluding human capital) is much greater than the inequality of income. This greater wealth inequality arises from two sources: 1. Life-cycle saving patterns 2. Transfers of wealth between generations The significant aspects of intergenerational wealth transfers that increase economic inequality is that marriage concentrates wealth. The Sources of Economic Inequality Copyright © 2013 Pearson Canada Inc., Toronto, Ontario

57
Income Redistribution The three main ways governments redistribute income are Income taxes Income maintenance programs Subsidized services Copyright © 2013 Pearson Canada Inc., Toronto, Ontario

58
Income Taxes The Canadian federal government and provincial governments tax incomes. By taxing incomes of different levels at different tax rates, economic inequality can be decreased. A progressive income tax is one that taxes income at an average rate that increases with income. The Canadian income tax system is a progressive income tax system. Income Redistribution Copyright © 2013 Pearson Canada Inc., Toronto, Ontario

59
A regressive income tax is one that taxes income at an average rate that decreases with income. A proportional income tax (also called a flat-rate income tax) is one that taxes income at a constant average rate for all income levels. Income Redistribution Copyright © 2013 Pearson Canada Inc., Toronto, Ontario
 is one that taxes income at a constant average rate for all income levels. Income Redistribution Copyright © 2013 Pearson Canada Inc., Toronto, Ontario.")
60
Income Maintenance Programs Three major types of programs, which redistribute income by making direct payments to individuals, are Social security Employment insurance Welfare Income Redistribution Copyright © 2013 Pearson Canada Inc., Toronto, Ontario

61
Subsidized Services A great deal of redistribution takes the form of subsidized services—services provided by the government at prices below the cost of production. The taxpayers who consume these goods and services receive a transfer in kind from the taxpayers who do not consume them. The two most important areas in which this form of redistribution takes place are education—both kindergarten through Grade 12 and college and university—and health care. Income Redistribution Copyright © 2013 Pearson Canada Inc., Toronto, Ontario

62
The Big Tradeoff Redistributing income leads to a tradeoff between equity and efficiency, known as the big tradeoff. Programs to redistribute income are inefficient for three reasons: 1. Income redistribution uses up resources that could have otherwise been used for producing goods and services. 2. Redistribution of income requires taxes to be imposed and taxes generate a deadweight loss. Income Redistribution Copyright © 2013 Pearson Canada Inc., Toronto, Ontario

63
3. Income redistribution decreases the incentives for … Taxpaying workers to provide labour when leisure is a normal good (by decreasing income from work) and Recipients of income assistance to provide labour and earn an income. A Major Welfare Challenge To find ways to assist the poorest identifiable group: Young minority women who have not completed high school, have dependent children, and live without a partner in the household. Income Redistribution Copyright © 2013 Pearson Canada Inc., Toronto, Ontario
 and Recipients of income assistance to provide labour and earn an income. A Major Welfare Challenge To find ways to assist the poorest identifiable group: Young minority women who have not completed high school, have dependent children, and live without a partner in the household. Income Redistribution Copyright © 2013 Pearson Canada Inc., Toronto, Ontario.")
64
The long-term solution to their plight is education and job training—acquiring human capital. The short-term solution is enforcing child support payments from absent fathers and former husbands, and providing welfare assistance. But it must be designed to minimize the disincentive to become self-sufficient. Income Redistribution Copyright © 2013 Pearson Canada Inc., Toronto, Ontario

Similar presentations