Download presentation
Presentation is loading. Please wait.

1
Higher Education, Diversity and PNC College Bound James B. Dworkin Chancellor November 29, 2005

2
Mean Earnings by Degree Level - Adjusted to 2001 $ Dollars (Using the Consumer Price Index) Source: US Census Bureau, Bureau of Labor Statistics $0 $10,000 $20,000 $30,000 $40,000 $50,000 $60,000 $70,000 $80,000 19751977197919811983198519871989199119931995199719992001 Less than High School High School Diploma Some College/Associate Degree Bachelor’s Degree Graduate/Professional Degree Figure 1
 Source: US Census Bureau, Bureau of Labor Statistics $0 $10,000 $20,000 $30,000 $40,000 $50,000 $60,000 $70,000 $80, Less than High School High School Diploma Some College/Associate Degree Bachelor’s Degree Graduate/Professional Degree Figure 1")
3
Shares of US Population (25 to 64 Year Olds) by Race/Ethnicity from 1980 to 2020 Source: US Census Bureau, Public Use Microdata Samples (Based on the 1980, 1990, and 2000 Census’) and US Population Projections Based on 2000 Census) Figure 2 * Native American/AK Native Projections Based on 1990 Census
 by Race/Ethnicity from 1980 to 2020 Source: US Census Bureau, Public Use Microdata Samples (Based on the 1980, 1990, and 2000 Census’) and US Population Projections Based on 2000 Census) Figure 2 * Native American/AK Native Projections Based on 1990 Census")
4
Educational Attainment of the US’ Young Workforce (Ages 25 to 34) Indexed to the Most Educated Country - 2000 Sources: US Census Bureau, Public Use Microdata Samples (Based on the 2000 Census), Organisation for Economic Co-operation and Development (OECD) Females Males White Females Males African-American Females Males Hispanic/Latino Females Males Native American/AK Native LEGEND Females Males Asian/Pacific Islander 0.8 0.9 0.4 0.5 0.3 0.4 0.3 0.4 1.2 0.9 1.0 0.4 0.5 0.3 0.4 0.3 1.6 1.5 0.0 0.2 0.4 0.6 0.8 1.0 1.2 1.4 1.6 1.8 NorwayCanada Bachelor’s Degree or HigherAll College Degrees (Associates or Higher) US Index = 0.86 US Index = 0.77 Figure 17
 Indexed to the Most Educated Country Sources: US Census Bureau, Public Use Microdata Samples (Based on the 2000 Census), Organisation for Economic Co-operation and Development (OECD) Females Males White Females Males African-American Females Males Hispanic/Latino Females Males Native American/AK Native LEGEND Females Males Asian/Pacific Islander NorwayCanada Bachelor’s Degree or HigherAll College Degrees (Associates or Higher) US Index = 0.86 US Index = 0.77 Figure 17")
5
Transition and Completion Measures from High School to College Completion - 2000 Source: National Center for Education Statistics Note: Data not available for Native Americans and Asians Figure 18 74.6% 64.2% 30.7% 57.1% 49.4% 54.6% 23.0% 38.1% 52.6% 51.7% 26.6% 44.7% 0% 20% 40% 60% 80% Graduate from High School on Time Recent High School Graduates that Go Directly to College Three-Year Graduation Rates of Associate Students Six-Year Graduation Rates of Bachelor's Students WhiteAfrican AmericanHispanic

6
Percent of Degree-Seeking First-Time Freshmen Graduating within 150% of Program Time by Race/Ethnicity - 2002 Source: National Center for Education Statistics, IPEDS Graduation Rate Survey 2002 WhiteAfrican-AmericanHispanic/LatinoNative American/AK NativeAsian/Pacific Islander 57.1 38.1 44.7 37.0 62.7 30.7 23.0 26.6 24.9 30.1 0% 10% 20% 30% 40% 50% 60% 70% Six-Year Graduation Rate of Bachelor’s StudentsThree-Year Graduation Rate of Associate Students Figure 20

7
Difference in Earnings Between a High School Diploma and a College Degree (1999) 25 to 64 Year Olds Working 35 or More Hours Per Week Source: US Census Bureau, Public Use Microdata Samples (Based on the 2000 Census) WhiteAfrican-AmericanHispanic/LatinoNative American/AK NativeAsian/Pacific Islander $7,432 $6,903 $8,434 $4,961 $9,056 $24,681 $15,790 $17,156 $15,341 $21,054 $0 $5,000 $10,000 $15,000 $20,000 $25,000 $30,000 Annual Earnings Gained from High School to an Associate Degree Annual Earnings Gained from High School to a Bachelor’s Degree Figure 23
 25 to 64 Year Olds Working 35 or More Hours Per Week Source: US Census Bureau, Public Use Microdata Samples (Based on the 2000 Census) WhiteAfrican-AmericanHispanic/LatinoNative American/AK NativeAsian/Pacific Islander $7,432 $6,903 $8,434 $4,961 $9,056 $24,681 $15,790 $17,156 $15,341 $21,054 $0 $5,000 $10,000 $15,000 $20,000 $25,000 $30,000 Annual Earnings Gained from High School to an Associate Degree Annual Earnings Gained from High School to a Bachelor’s Degree Figure 23")
8
FIGURE 5 – The percentage of the working-age population (ages 25 to 64) with a bachelor’s degree or higher has increased for all racial/ethnic groups, but the gaps between the groups have widened.
 with a bachelor’s degree or higher has increased for all racial/ethnic groups, but the gaps between the groups have widened.")
9
FIGURE 7 – If current educational gaps remain, there will likely be a substantial increase in the percentage of the workforce with less than a high school diploma – and declines in the higher levels of education completed. Share of Population (ages 25 to 64) Projected to Attain the Following Educational Levels
 Projected to Attain the Following Educational Levels.")
10
What is PNC Doing to Help? PNC COLLEGE BOUND

11
PNC College Bound Partnership between PNC and the Michigan City Area Schools. Students who complete this program, if admitted to a baccalaureate degree program at PNC, will receive a full scholarship to attend classes here. First class of 8th graders selected this year.

12
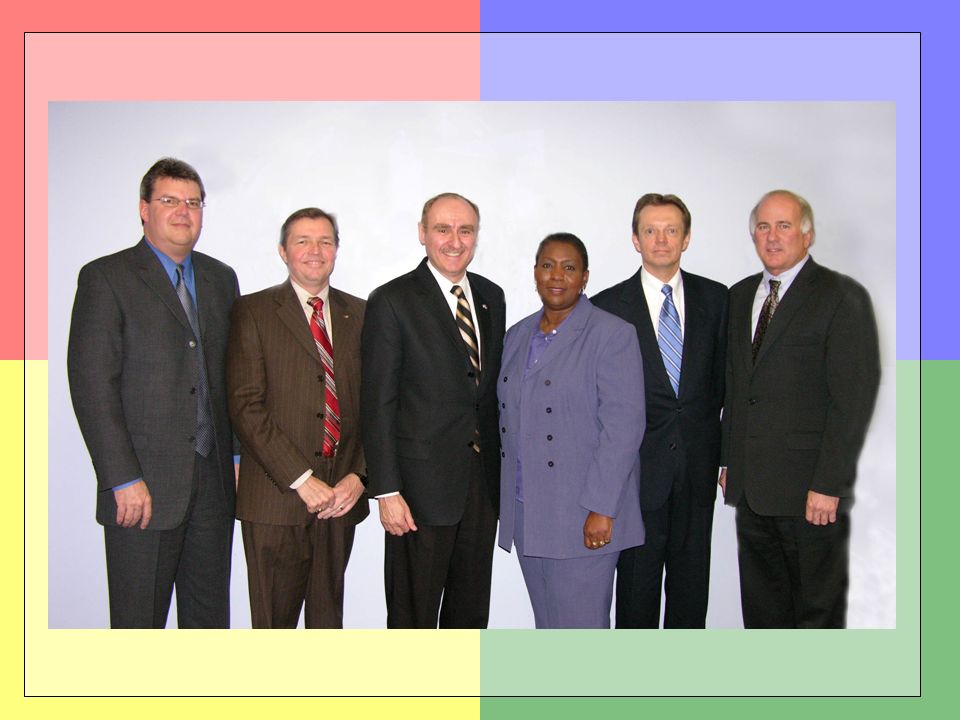
PNC College Bound Sponsors Horizon Bank Sullair Corporation NIPSCO City Savings Bank South Shore/South Bend Railroad

14
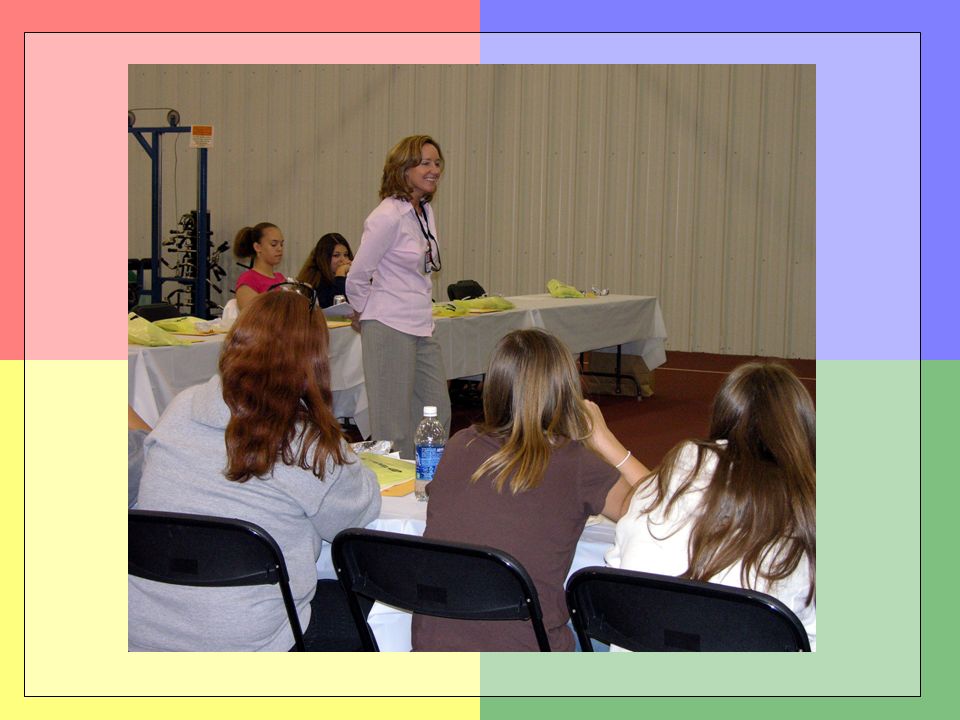
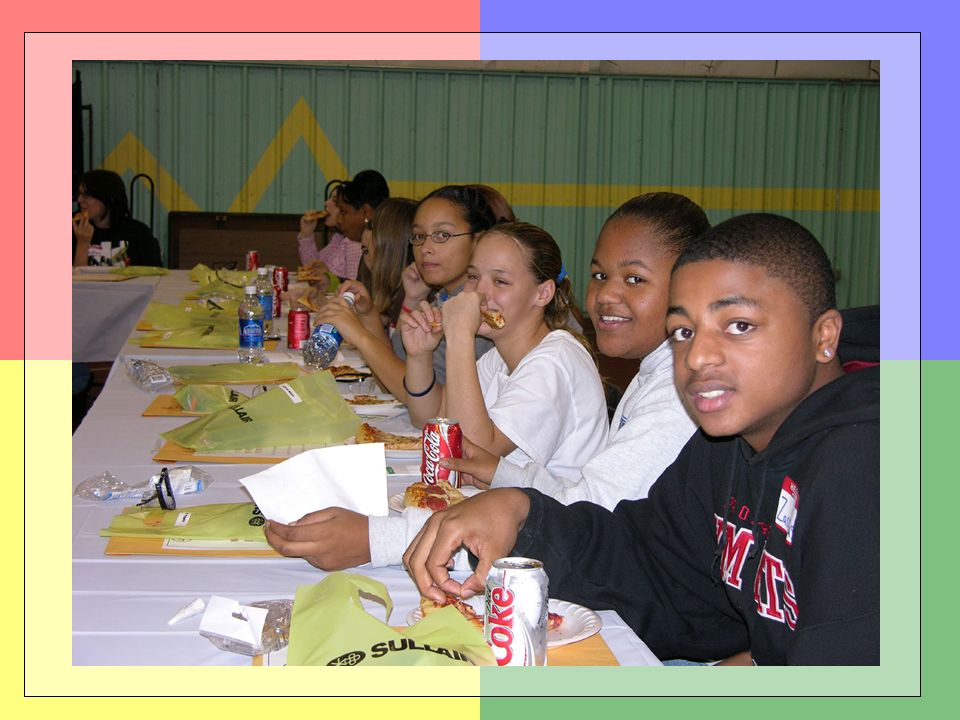
Students Visit to Sullair Corporation

17
Watch for Announcement At Martin Luther King Day Celebration Breakfast On Monday, January 16, 2006!

18
QUESTIONS ? ? ? ?

Similar presentations


 Age 18-24 Age 25-64 Speak English Poorly or Not at All – Age 18 to 64 (%) High.>")
 June 2009.>")


. Statistics.>")

 Source: U.S. Census Bureau,>")
 Age 18-24 Age 25-64 Speak English Poorly or Not at All – Age 18 to 64 (%) High.>")
 Age 18-24 Age 25-64 Speak English Poorly or Not at All – Age 18 to 64 (%) High.>")


 Age 18-24 Age 25-64 Speak English Poorly or Not at All – Age 18 to 64 (%) High School.>")