Download presentation
Presentation is loading. Please wait.

1
Management and Use of LiDAR-Derived Information Elizabeth Cook USDA-NRCS Columbia, MO

3
Now What?

4
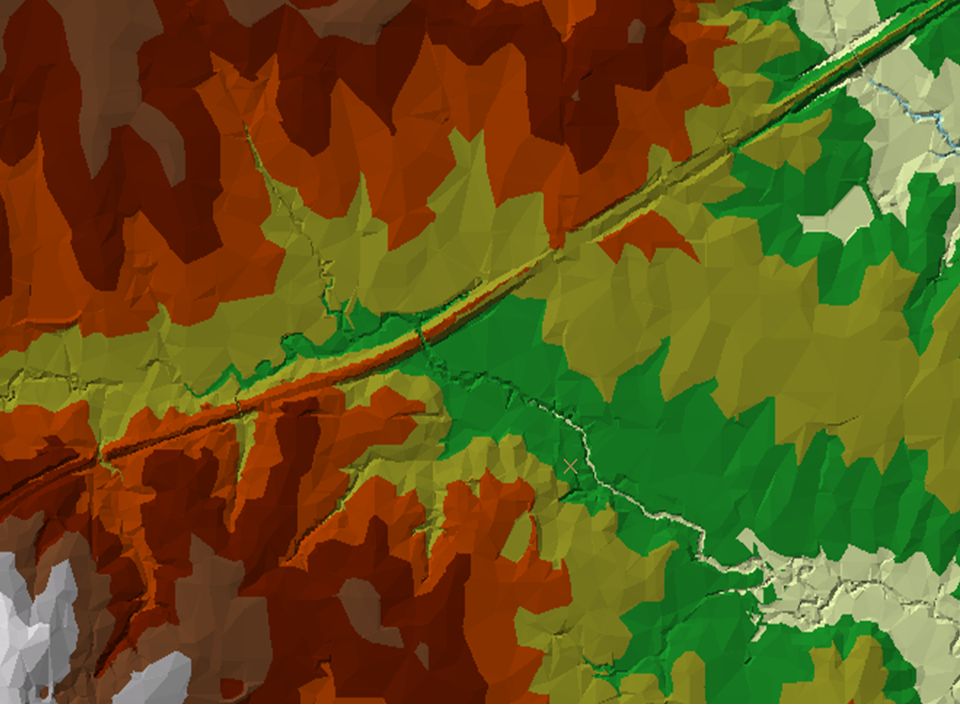
Study Area

5
Project Deliverables LAS mass point files, all returns, with and without breaklines, qq quad tiles 1-m ESRI Grid bare earth DEM files, quad and qq quad tiles 1-foot pixel natural color digital orthophotos in geotiff, ecw and sid formats (collected with LiDAR and used for breakline mapping) Independent control points for QA Misc shapefiles – tile indexes, breaklines
 Independent control points for QA Misc shapefiles – tile indexes, breaklines")
6
Data Management – File Sizes Total for 4-county project area Grid DEMs 31.4 gb LAS 92 gb Imagery 261.2 gb (one format or version of the data) One 7.5-minute quad Grid DEM – 585 mb LAS 1.8 gb Imagery 4.6 gb
 One 7.5-minute quad Grid DEM – 585 mb LAS 1.8 gb Imagery 4.6 gb")
7
Data Management – Formats, Areas of Coverage, Products Method 1 – deliver “raw” data, such as LAS, ASCII mass point files or ESRI terrains; users clip to areas of interest and process derivatives Method 2 – deliver tiles of derivatives according to anticipated users needs Method 3 – deliver some derivatives, but customize as necessary, and let high-end users process their own

8
Data Formats – “Raw” LAS – industry standard binary file of x,y,z,i (and more) data not many softwares read (changing fast) may want to generalize, sample per class, etc ASCII x,y,z large and slow ESRI Terrain – multi-resolution database object that “stages” the data for subset, generalization and derivatives requires knowledgeable users lots of time to create
 data not many softwares read (changing fast) may want to generalize, sample per class, etc ASCII x,y,z large and slow ESRI Terrain – multi-resolution database object that stages the data for subset, generalization and derivatives requires knowledgeable users lots of time to create")
9
Terrain visualized as a TIN; resolution based on scale of display and pyramid levels of terrain

11
Derivative Data from LiDAR Digital Elevation Model (bare-earth raster) Digital Surface Model (with canopy) Hillshade TIN – ESRI vs. CAD Contours All are 2-D representations of terrain

19
Applications to Conservation Planning

20
LiDAR data can speed design time by eliminating much of the field survey. This dam was designed in 15 minutes without ever going to the field.

21
Improving Soil Map Unit Boundaries

23
Standard 10m DEM from hypsography

24
1m LiDAR

26
Flooding Frequency Interp. Soils

27
Using LiDAR First Returns

30
1.Extract first return LiDAR points 2.Low-pass filter to generalize 3.Polygonize for forest/non-forest layer (red mask)
")
32
Helping People Help the Land The U.S. Department of Agriculture (USDA) prohibits discrimination in all its programs and activities on the basis of race, color, national origin, age, disability, and where applicable, sex, marital status, familial status, parental status, religion, sexual orientation, genetic information, political beliefs, reprisal, or because all or a part of an individual's income is derived from any public assistance program. (Not all prohibited bases apply to all programs.) Persons with disabilities who require alternative means for communication of program information (Braille, large print, audiotape, etc.) should contact USDA's TARGET Center at (202) 720-2600 (voice and TDD). To file a complaint of discrimination write to USDA, Director, Office of Civil Rights, 1400 Independence Avenue, S.W., Washington, D.C. 20250- 9410 or call (800) 795-3272 (voice) or (202) 720-6382 (TDD). USDA is an equal opportunity provider and employer.
 prohibits discrimination in all its programs and activities on the basis of race, color, national origin, age, disability, and where applicable, sex, marital status, familial status, parental status, religion, sexual orientation, genetic information, political beliefs, reprisal, or because all or a part of an individual s income is derived from any public assistance program. (Not all prohibited bases apply to all programs.) Persons with disabilities who require alternative means for communication of program information (Braille, large print, audiotape, etc.) should contact USDA s TARGET Center at (202) (voice and TDD). To file a complaint of discrimination write to USDA, Director, Office of Civil Rights, 1400 Independence Avenue, S.W., Washington, D.C or call (800) (voice) or (202) (TDD). USDA is an equal opportunity provider and employer..")
Similar presentations


267-2756 Monthly.>")


 Fiscal Year 2012 Announcement for Program Funding January 17, 2012 Gregorio Cruz, National CIG Program Manager.>")


 Procedure Know Your Rights USDA Natural Resources Conservation Service WIsconsin.>")
 Guidance Memorandum.>")


