Download presentation
Presentation is loading. Please wait.

2
The Nature of The World and Its Impact on Data Preparation Arief Fatchul Huda UT-2014

3
Contents Overview Measuring the world Type of Measurement Continua of Attributes of Variables Scale Measurement Example Transformation and Difficulties-Variables Building Mineable Data Representations Summary

4
Overview Data Explore --> –discover about the data –discover about the world Data Mining --> –tools for discovering knowledge --> knowledge discoverable from data collections

5
Overview data --> some persistent relationship to the world data relationships --> meaningfully related back to real-world phenomena

6
Measuring the World Objects Capturing Measurements Error of Measurement Tying Measurement to the Real World

7
Measuring the World world : place of unbelievable complexity –infinite depth of detail –(brain and mind) simplifying that complexity Using this simplicities –collect and record impression all things(data) From Data --> explore (using data mining) –undestand something about reality (discover information)
 simplifying that complexity Using this simplicities –collect and record impression all things(data) From Data --> explore (using data mining) –undestand something about reality (discover information)")
8
Data rich and copious real world : fluid, rich, and complex powerful the exploring tools or aggressive the explorer --> nothing can be discovered that is beyond the limits of the data itself

9
Objects World --> objects that can identify Object --> comprice the fundamental underpinning/interface that use to mining them Mining --> explore the relationships Objects : collections of features about which measurements can be taken

10
Object Example : car, event Object : –physical –abstract / concept Related to each other Interact to each other

11
Capturing Measurements Objects : consist of measurements of features features : characteristics of the objects Examp : –Cars : colors, doors, cylinders, Measurements : –particular type of validity –validating circumstance

12
Errors of Measurement Measurement –quality to measure –device to calibrate –physical –non-physical Error –quantity is not correctly compared to the calibration –incorrect comparison

13
distortion/error

14
calibration errors

15
Environmental error express the uncertainty due the nature of the world

16
envi errors

17
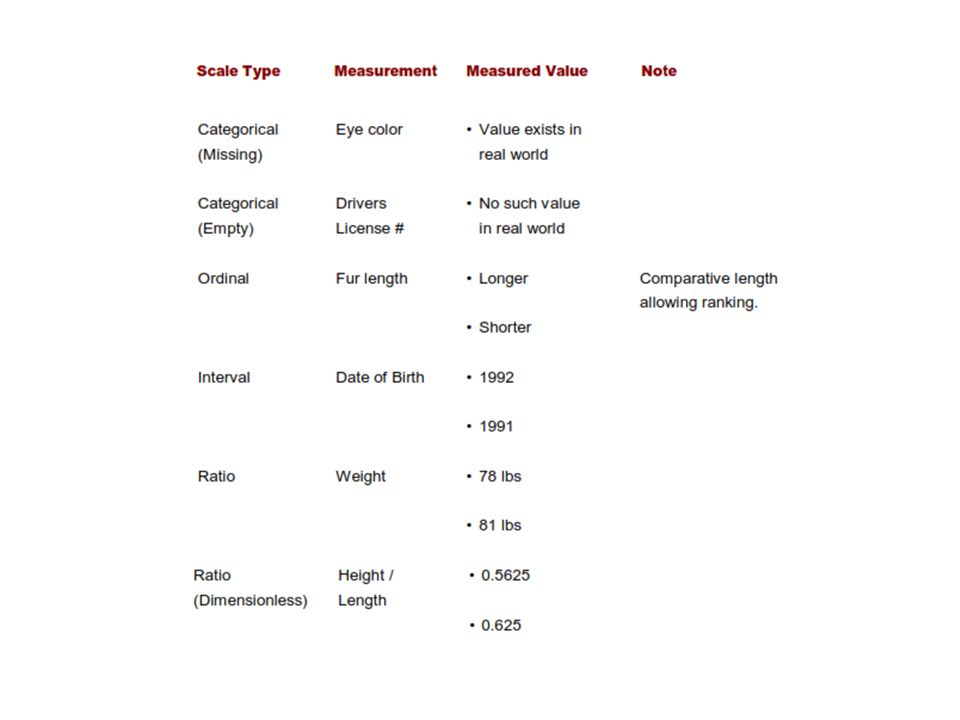
Tying of Measurements to Real World Measurements : –actual absolute value –distortion --> error Types of Measurements

18
Types of Data

19
Types of data Categorical data Measurement data

20
Categorical Data The objects being studied are grouped into categories based on some qualitative trait. The resulting data are merely labels or categories.

21
Examples: Categorical Data Hair color –blonde, brown, red, black, etc. Opinion of students about riots –ticked off, neutral, happy Smoking status –smoker, non-smoker

22
Nominal, Ordinal, and/or Binary Categorical data classified as Nominal, Ordinal, and/or Binary Categorical data Not binaryBinary Ordinal data Nominal data BinaryNot binary

23
Nominal Data A type of categorical data in which objects fall into unordered categories.

24
Examples: Nominal Data Hair color –blonde, brown, red, black, etc. Race –Caucasian, African-American, Asian, etc. Smoking status –smoker, non-smoker

25
Ordinal Data A type of categorical data in which order is important.

26
Examples: Ordinal Data Class –fresh, sophomore, junior, senior, super senior Degree of illness –none, mild, moderate, severe, …, going, going, gone Opinion of students about riots –ticked off, neutral, happy

27
Binary Data A type of categorical data in which there are only two categories. Binary data can either be nominal or ordinal.

28
Examples: Binary Data Smoking status –smoker, non-smoker Attendance –present, absent Class –lower classman, upper classman

29
Measurement Data The objects being studied are “measured” based on some quantitative trait. The resulting data are set of numbers.

30
Examples: Measurement Data Cholesterol level Height Age SAT score Number of students late for class Time to complete a homework assignment

31
Discrete or Continuous Measurement data classified as Discrete or Continuous Measurement data Continuous Discrete

32
Discrete Measurement Data Only certain values are possible (there are gaps between the possible values). Continuous Measurement Data Theoretically, any value within an interval is possible with a fine enough measuring device.

33
Discrete data -- Gaps between possible values 0 1 2 3 4 5 6 7 Continuous data -- Theoretically, no gaps between possible values 0 1000

34
Examples: Discrete Measurement Data SAT scores Number of students late for class Number of crimes reported to SC police Number of times the word number is used Generally, discrete data are counts.

35
Examples: Continuous Measurement Data Cholesterol level Height Age Time to complete a homework assignment Generally, continuous data come from measurements.

38
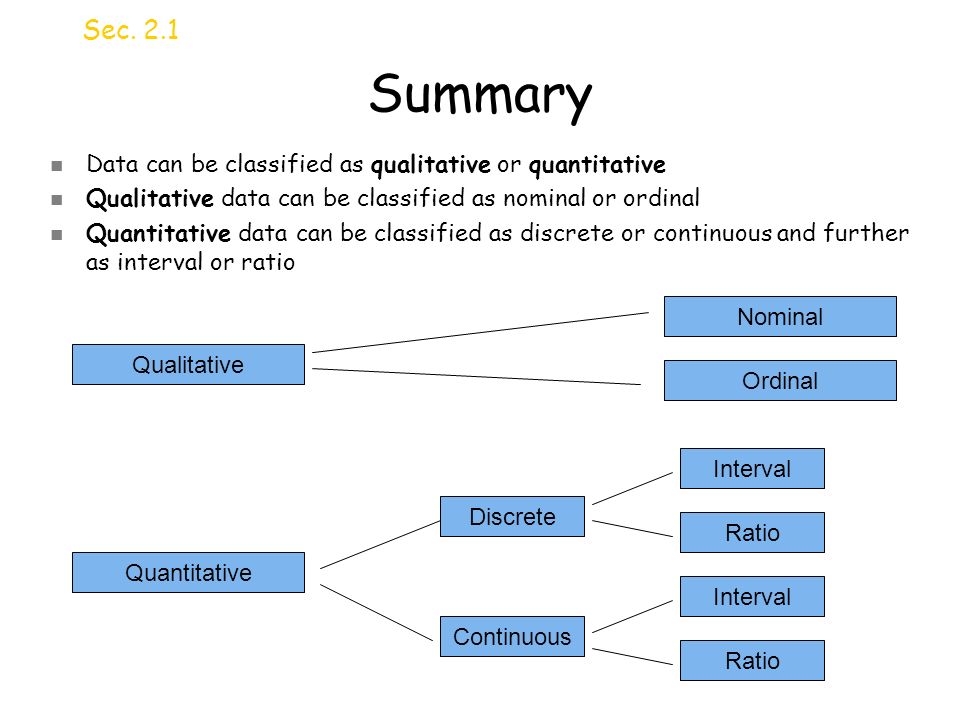
Summary Sec. 2.1 Data can be classified as qualitative or quantitative Qualitative data can be classified as nominal or ordinal Quantitative data can be classified as discrete or continuous and further as interval or ratio Qualitative Quantitative Nominal Ordinal Discrete Continuous Interval Ratio Interval Ratio

39
Transformations and Difficulties Information –in data set –contens of various scales –transforming inform Information –Crucial –data being mined –reason to prepare the data set

40
Transformations and Difficulties DM purpose transform inform content that cannot –directly used –understood by human --> form that can be understood and used Chapt 11, technical aspects of information theory Inform not be perfect –uncertainty –knowledge will not be complete –better inform --> better model

41
Building Mineable Data Rep Data Representation Building Data Building Mineable Data Set –validating condition/phenomena

42
Intentional feature of data –measurement –degree of precision –validating phenomenon form structure of data

43
Data Representation Tools --> computer –Table –Matrix –Spreadsheet

44
Building Data - Dealing with variables Data –variable to be considered as individual entities, their interaction/relationship Data set – data + interactions and interrelationships

45
variable as object removing variables sparsity monocity increasing dimensionality outliers numerating Categorical Values anachronisms

46
Variable as Object measurement --> valid imposible to look all the variable in the instances –impractical –not enough instance values Chapt 5 --> describe how to discover enough data available to come to valid conclusions

47
Variable as Object it is important to have enough representative data a number of features of the variable are inspected

48
Removing Variables Information is only carried in the pattern of change of value of a variable with changing circumstances No change --> no information Problematic --> most of instance values are empty –Sparsity

49
Sparsity Chapt 10

50
Monotonicity increases without bound –relationship Example –Date Transform –Date --> seasoning Chapt 5

51
Increasing Dimensionality Problem : reduce dimensionality Chapt 5

52
outliers

53
Building Mineable Data Sets Objective –make easy to mining –obviate the problems

54
Building Mineable Data Sets Exposing the information content Getting enough Data Missing and Empty Values The shape of the data set

Similar presentations