Download presentation
Presentation is loading. Please wait.

1
Social Security Financing October 16, 2006

2
By the end of today you should be able to: Explain how Social Security’s “pay as you go” financing works Describe the long-run financial problems facing the system Describe the factors that are responsible Describe the “hard facts” of what is required to fix the problem

3
What Do You Believe?

4
What Do Others Believe?

5
Discussion What do you think is the problem with Social Security? Do you believe it can be fixed? What benefits, if any, do expect from it?

6
Summary of 2005 Trust Fund Financial Operations (Table II.B1) Billions of $ Assets at end of 20041,687 Total income in 2005+702 Payroll contributions 593 Income taxation of benefits 15 Interest 94 Total expenditures in 2005-530 Net increase in assets in 2005+172 Assets at end of 20051,859
 Billions of $ Assets at end of 20041,687 Total income in Payroll contributions 593 Income taxation of benefits 15 Interest 94 Total expenditures in Net increase in assets in Assets at end of 20051,859")
7
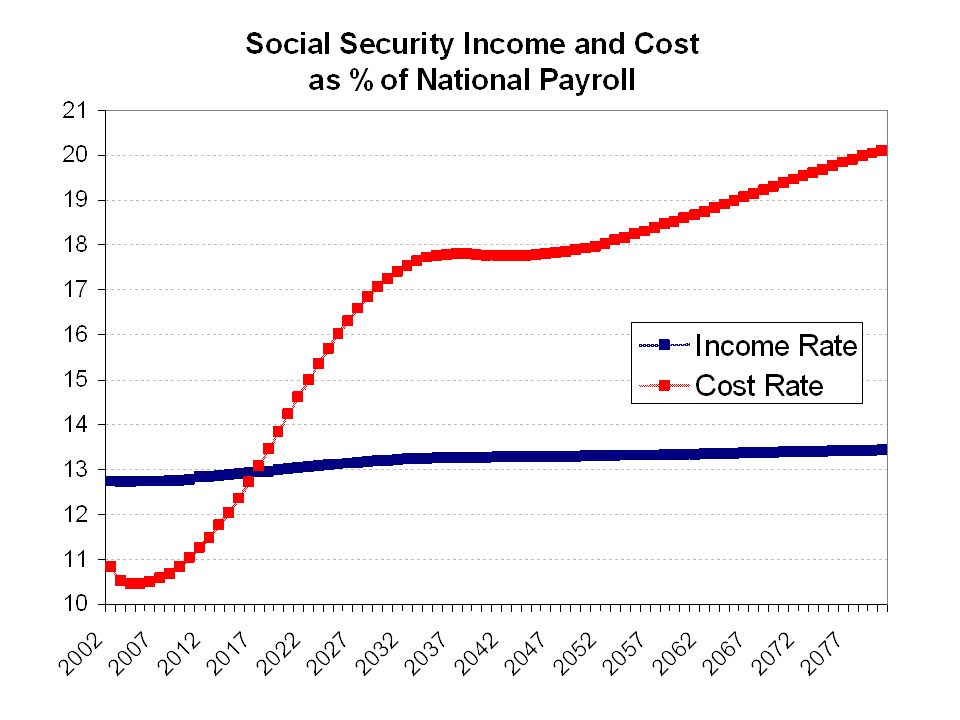
So What is the Problem? In 2005, we are ran a large surplus So what is the problem? Why does Social Security need “saved?” “Pay-As-You-Go”: Taxes paid by today’s workers are used to finance today’s retirees

9
How Big is the Financing Gap? Present value of the shortfall over next 75 years = $4.6 trillion Present value of shortfall as % of taxable payroll over next 75 years = 2.02% Annual deficit in 2080 = 5.38% of payroll Program costs 4.3% of GDP today, and will rise to 6.3% of GDP by 2080 Over an infinite horizon, shortfall is $13.4 trillion

10
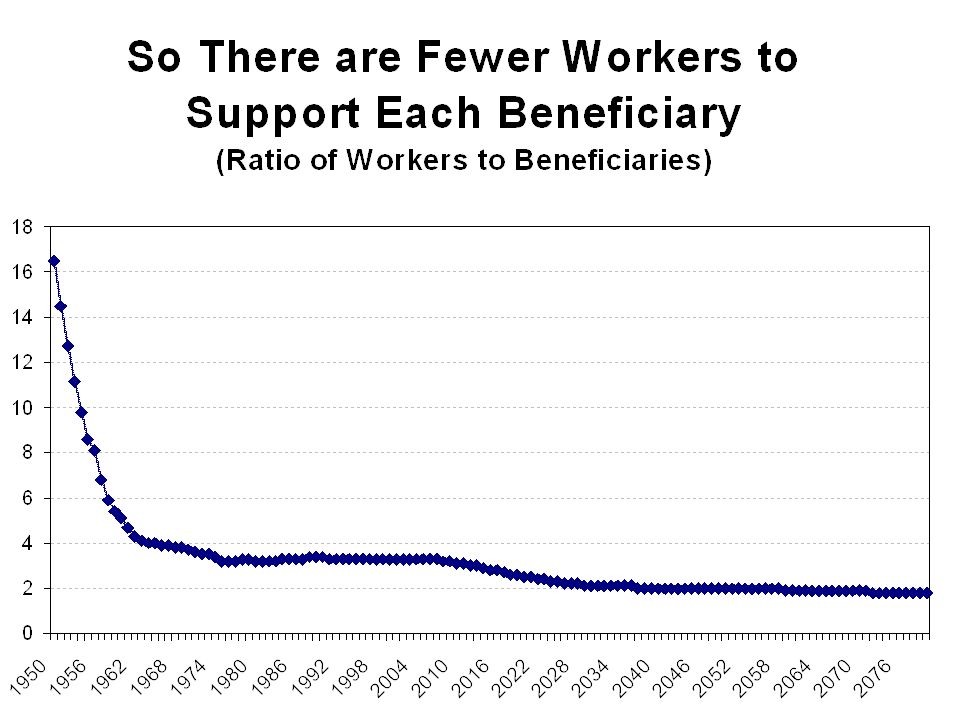
Sources of the Problem Demographics Rising Life Expectancies Declining Birthrates Declining ratio of workers to retirees Structure of the Current System Inability to “grow our way out”

11
People Are Living Longer Generation born in 1875 Only 40% of males reached age 65 in 1940 Those that did lived another 12.7 years Generation born in 1935 69% of males reached age 65 in 2000 Those that did expected to live 16.2 years Generation born in 1985 84% of males will reach age 65 in 2050 Those that do can expect to live 19.1 years

12
And Having Fewer Children Total U.S. fertility rate 2.2 children per woman in 1940 3.2 in 1947 3.7 in 1957 1.8 in mid-1970s Now approximately 2.0

14
Is the Problem Real? There are some who assert that economic growth will save us … NY Times’ Paul Krugram refers to the “bonanza” of tax revenue that higher growth would bring Baker & Weisbrot’s book “The Phony Crisis” also downplays the problem Some politicians have said that Social Security is just fine for another 4-5 decades What to believe?

15
Is the Problem Real? It is not a “crisis” But it is a serious long-term problem Demographic changes are definitely coming – we know that the ratio of workers to retirees is declining In a pay-as-you go system, either benefits must fall or taxes must rise

16
Will Growth Save Us? Baseline SSA assumptions include economic growth But are economic growth assumptions too pessimistic? Productivity assumptions seem reasonable Low economic growth assumptions stem from slower growth in labor force

17
Technical Panel Findings Social Security Advisory Board appoints a Technical Panel on Methods and Assumptions to review Trustees Report In 2003, report made recommendations about immigration, mortality, labor force, wages and inflation What did they find?

18
Effect of Technical Panel Changes on SS Finance Status Net effect of: Increase immigration Increasing rate of mortality decline Eliminating rise in labor force participation rates of older persons Increasing projected real growth rate Decreasing projected inflation Only changed 75-year actuarial balance by 0.01 percent of payroll

19
So, What Do We Do About It? Option 1: Ignore the problem Option 2: Raise taxes Option 3: Cut other spending Option 4: Reduce scheduled benefits Option 5: Generate higher returns Option 6: Let’s examine each option in turn to see what will and what will not work …

20
Option 1: Ignore the Problem “Do nothing” appears to be the default policy position Problem will grow worse each year With each passing year, we have one fewer surplus year ahead of us, and one more deficit year ahead of us And we will have fewer options Will become harder to protect older cohorts Will require larger sacrifices

21
Option 2: Raise Taxes This certainly helps to balance the books How big a tax increase is required? By 2080, the 12.4% payroll tax would need to be over 18% At the same time that burden from Medicare and Medicaid will grow even faster Possibly deleterious effects of high taxation Reduced labor supply incentives Reduced economic growth Note: Borrowing is just a future tax increase!

22
Option 3: Cut Other Spending We could divert spending from other programs But numbers are mind-boggling In 30 years, the annual shortfalls (adjusted for inflation) are over $300 billion Would require crowding out huge proportion of non-defense discretionary spending
 are over $300 billion Would require crowding out huge proportion of non-defense discretionary spending")
23
Option 4: Reduce Benefits Social Security is not a super-generous program to start with “Unfair” to cut benefits to those already retired no time to adjust What about future cohorts? If slowed the rate of growth of benefits by about 1% per year (roughly difference between wages and prices), deficits disappear in long run But replacement rates from SS would be sharply reduced
, deficits disappear in long run But replacement rates from SS would be sharply reduced.")
24
Option 5: Higher returns Popular idea: invest in stocks to generate higher returns Central government investment of Trust Fund Personal accounts Problems with this logic Stock returns higher than bonds because of compensation for risk – no free lunch Social Security return also low because of “debt overhang” – this won’t go away More on pros and cons next time …

25
Key Issues in the Reform Debate How restore solvency? New revenue vs. changes to benefits Individual accounts (IA’s) or not? How to structure IA’s? The accumulation phase “Add-on” vs. “carve-out” Investment options, vendors, costs Access restrictions Payout phase Annuitization Risk vs. return Paying for the transition / savings
 or not. How to structure IA’s. The accumulation phase Add-on vs. carve-out Investment options, vendors, costs Access restrictions Payout phase Annuitization Risk vs. return Paying for the transition / savings.")
Similar presentations


 contribute a limited yearly.>")