Download presentation
Presentation is loading. Please wait.

1
In the diagram at left, an observer in New York State “sees” the sun at three different noon-times during the course of a year (X, Y, and Z). ZENITH

2
In the diagram at left, an observer in New York State “sees” the sun at three different noon-times during the course of a year (X, Y, and Z). ZENITH

4
(Put an X on NYS in the diagram at right!) ON THE DIAGRAM, draw 5 stick figures ( ), one at the Equator, one at each 30 o (N & S) and one at each Pole (North & South).
 ON THE DIAGRAM, draw 5 stick figures ( ), one at the Equator, one at each 30 o (N & S) and one at each Pole (North & South).")
5
Textbook pg. 375

6
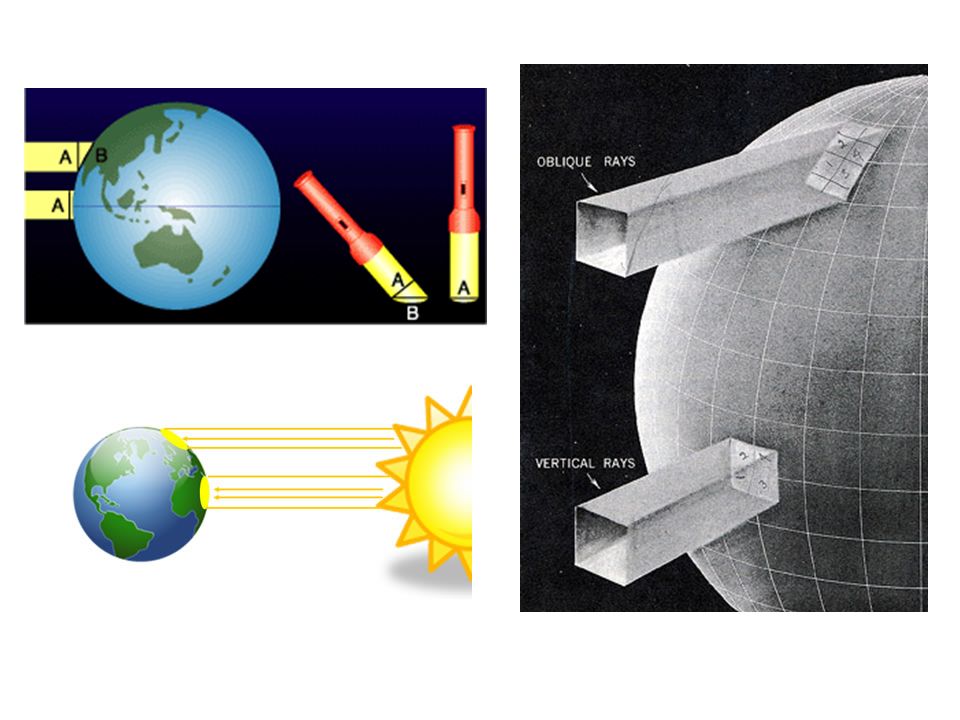
Which light waves are more concentrated? Which light waves are more diffuse?

7
Which has more energy? They are both equal! One is more diffuse and one more concentrated!

8
Which diagram best shows the noon Sun providing an observer with the greatest amount of insolation? WHY?

10
Angles of insolation vary for 3 reasons:

13
8 9 10 11

14
Angles of insolation vary for 3 reasons:

Similar presentations


 December (3) June (2) September (4)>")


 it has one of these signs: < : less than ≤ : less than or equal to.>")


