Download presentation
Presentation is loading. Please wait.

1
Robustness of eddy correlation for Amazon rainforest fluxes Kruijt,B. 1)#), Elbers, J.A. 1), von Randow, C. 2), Araujo, A.C. 3), Oliveira, P.J. 2), Culf, A. 4), Manzi, A.O. 2), Nobre, A.D. 3), Kabat, P. 1) 1) Alterra, NL, 2) CPTEC/INPE, Brazil, 3) INPA, Brazil, 4) CEH, UK
#), Elbers, J.A. 1), von Randow, C. 2), Araujo, A.C. 3), Oliveira, P.J. 2), Culf, A. 4), Manzi, A.O. 2), Nobre, A.D. 3), Kabat, P. 1) 1) Alterra, NL, 2) CPTEC/INPE, Brazil, 3) INPA, Brazil, 4) CEH, UK.")
2
We want to: rigorously quantify the uncertainties in our eddy correlation data assess how choices in the flux calculation affect the end result assess which are the important aspects in eddy correlation methodology to get right

3
Mean Diurnal trend of CO 2 fluxes at four sites Dry Wet Dry seasons: Forest peak uptake similar, nights different. Pasture lower uptake! Wet seasons: Forests and pasture very similar.

4
Ecosystem response at monthly time scales Radiation Rainfall

5
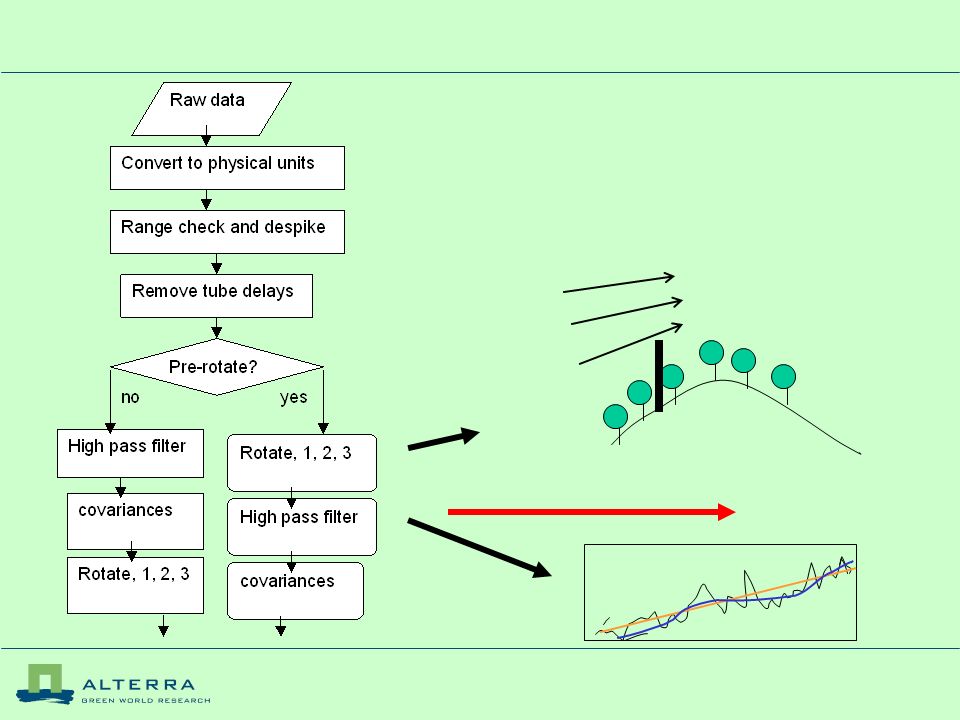
Methods Eddy correlation: Systems based on ‘Edisol’ (Moncrieff et al, 1996) and ‘Euroflux’ (Aubinet et al, 1999) closed-path principle. Gill-Solent 3-D sonic anemometer Li-Cor 6262 Gas analyser SHORT tube, high pumping rate Calculation: delay removal, 3 rotations, 800s recursive detrend, correction for detrend loss of low frequencies (Except at Caxiuana) Storage fluxes: in-canopy profiles of CO 2 and H 2 O (CIRAS SC analyser) Meteorological data: Automatic weather station, short&long wave radiation, etcetera.
 Storage fluxes: in-canopy profiles of CO 2 and H 2 O (CIRAS SC analyser) Meteorological data: Automatic weather station, short&long wave radiation, etcetera..")
6
EUSTACH Sites Manaus K34 and Manaus C14 Caxiuana Rebio Jaru Fazenda Nossa Senhora

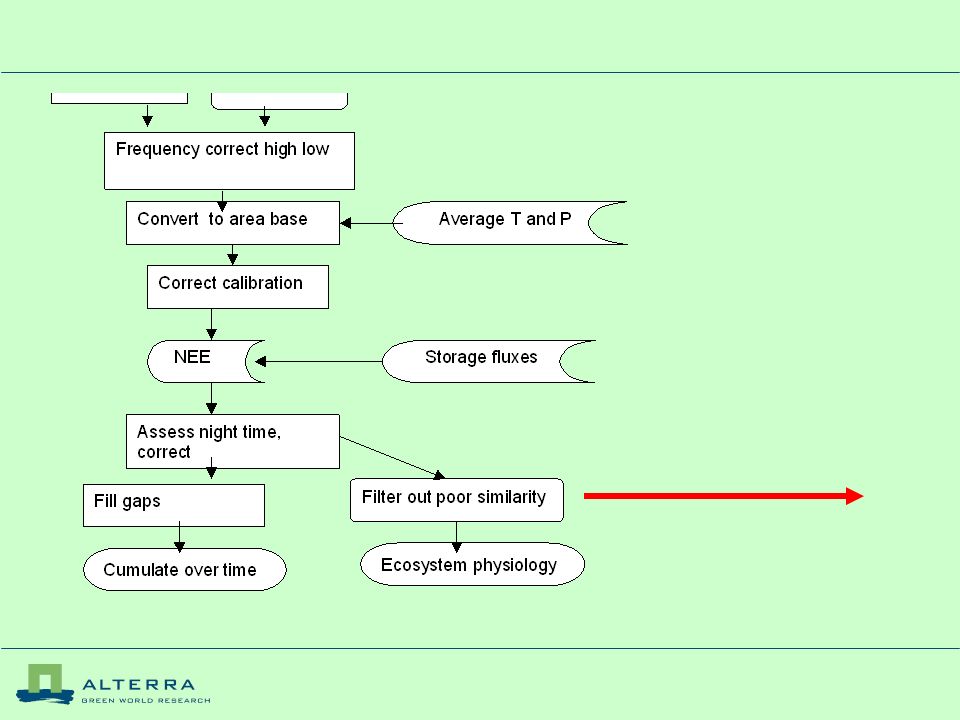
7
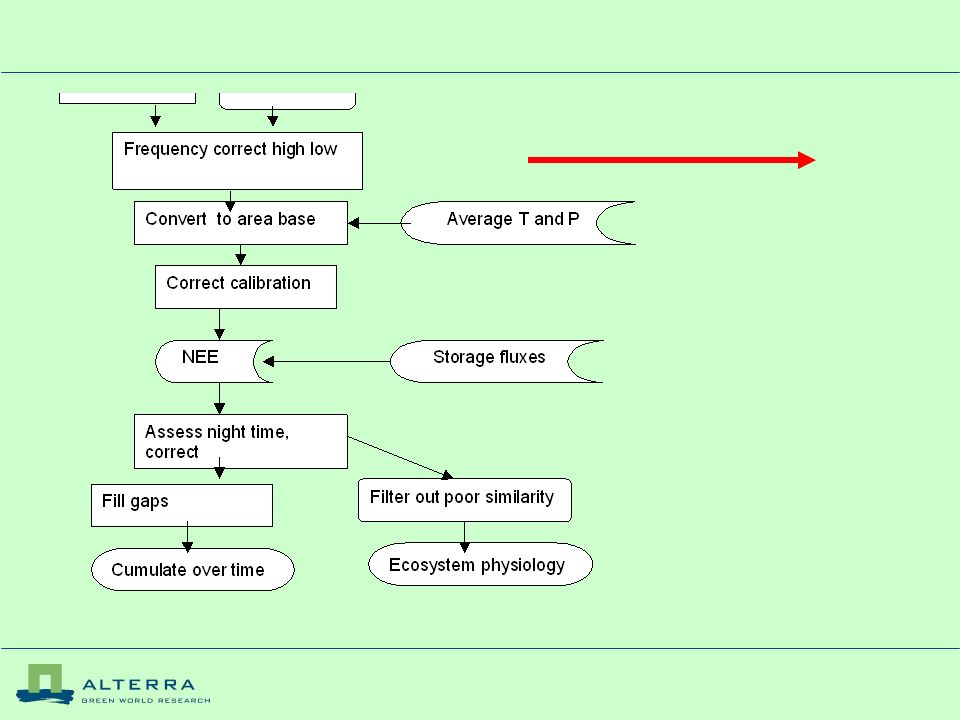
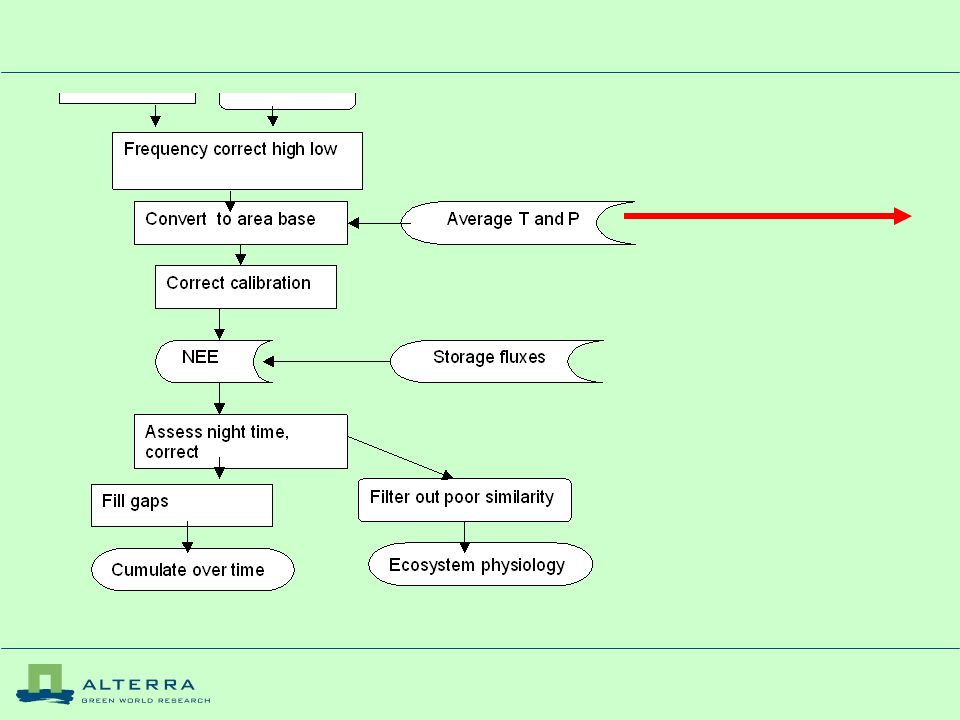
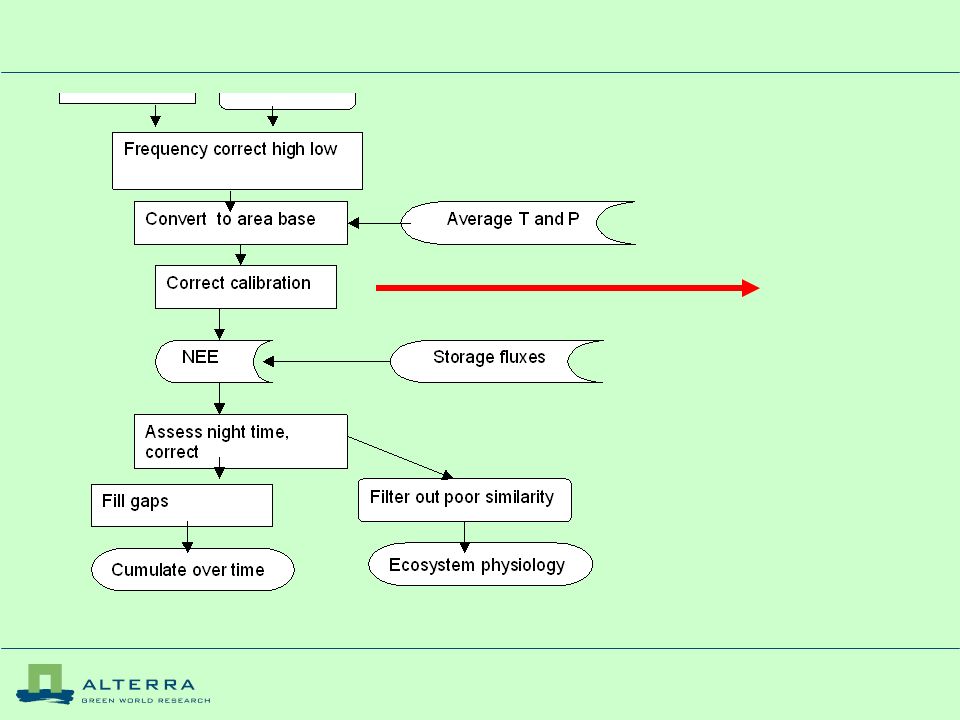
Robustness of Eddy correlation Flowchart of the main steps in flux calculations

9
Effect of spikes in one channel only 5 ppm and 50 ppm spike on CO2. Effect is random relative uncertainty, increasing with spike/signal ratio

11
Uncertainty in tube delay calculations

13
Detrending, averaging and rotation

14
Summary effects of rotation and averaging Variation in sensitivities to treatments Relative effects of averaging time and rotation

15
Total uncertainty from rotation and averaging over the day

17
Frequency corrections Zero-plane, tube NOT important. Low frequencies ARE important.

19
Conversion ppm m s -1 to area based fluxes Small potential errors average out over days

21
Uncertainty in calibration Calibration a posteriori causes problems and uncertainty

23
Similarity relations - representativity for surface Filtering for poor similarity will discard important periods such as early morning

24
Uncertainty as a function of the percentage good data - Rebio Jaru

25
Uncertainty on annual totals from (well distributed) data gaps
 data gaps")
26
And finally….

27
Total one-sided error on annual totals is, apart from night-time error, between 12.5% and 32%, or 1-2 t ha -1.

28
One of the major uncertainties is associated with rotation and averaging. This seems to increase with non-stationarity, or with ‘meso-scale’ landscape heterogeneity. How to reduce this uncertainty: first principles - better solve the mass budget? Other ways?

Similar presentations


, Nobre, A D 2), Grace, J 3),>")
 Thousands of years ago Carbon dioxide concentrations over the last.>")


