Download presentation
Presentation is loading. Please wait.

1
Dir. Jesus T. Tamang Energy Policy and Planning Bureau DEPARTMENT OF ENERGY The Need for Fuel Mix Policy

2
Primary Energy Supply, MTOE Energy Mix 2 Fuel Source 199019952000200520102013AAGR Oil 10.6416.5515.9013.6413.6113.71 1.1% Coal 1.241.544.245.037.0210.00 9.5% Natural Gas 0.00 0.012.703.032.89 Renewables 14.7814.1918.3216.4017.3818.40 1.0% Total 26.6732.2938.4737.7841.0445.002.3%

3
Primary Energy Supply, MTOE Energy Mix 3 Fuel Source 199019952000200520102013AAGR Oil 10.6416.5515.9013.6413.6113.71 1.1% Coal 1.241.544.245.037.0210.00 9.5% Natural Gas 0.00 0.012.703.032.89 Renewables 14.7814.1918.3216.4017.3818.40 1.0% Total 26.6732.2938.4737.7841.0445.002.3%

4
Power Generation Fuel Mix, in MTOE

5
% Share of Power Generation in Primary Energy Supply Increase/Decrease per fuel, 1990-2013

6
Power Generation Generation Mix, in GWh 75,266 GWh in 2013

7
Increase between 1990- 2013 Power Consumption by Sector in GWh

8
Primary Energy Supply, MTOE Selected Indicators

9
Power Demand Outlook by Fuel – Electric Power in GWh

10
Power Demand Outlook CO2 Emission in MTCO2 30% Reduced emissions (e.g. CO2, PM, SOx, NOx) from power generation can help improve people’s health conditions and productivity
 from power generation can help improve people’s health conditions and productivity.")
11
Develop Indigenous Energy Resources Expand Use of Natural Gas Push Sustainable Fuels for Transport Make Energy Efficiency a Way of Life Expand capacity and coverage of Power Supply Climate-proof energy infrastructure and facilities Energy Programs

12
Dir. Jesus T. Tamang Energy Policy and Planning Bureau DEPARTMENT OF ENERGY The Need for Fuel Mix Policy

13
Energy Reference System

14
Power Demand Outlook Selected Indicators – increasing electrification PEP 2012-2030

15
Implement the National Climate Change Action Plan (NCCAP) in the energy sector Mitigation action mainly through energy efficiency, renewable energy and alternative fuels and technology programs Conduct vulnerability assessment of the energy sector Identify and pursue adaptation programs Upgrade standards for energy systems and facilities Energy Programs Promote a Climate Change Resilient Energy Sector
 in the energy sector Mitigation action mainly through energy efficiency, renewable energy and alternative fuels and technology programs Conduct vulnerability assessment of the energy sector Identify and pursue adaptation programs Upgrade standards for energy systems and facilities Energy Programs Promote a Climate Change Resilient Energy Sector")
16
Factors Affecting Energy Demand

17
199019952000200520102013AAGR TPES/GDP (TOE/PhPM) 10.02 10.84 10.74 8.43 7.20 6.65-1.8% TPES per Capita (TOE/person) 0.44 0.47 0.50 0.44 0.460.2% Primary Energy Supply, MTOE Selected Indicators
 % TPES per Capita (TOE/person) % Primary Energy Supply, MTOE Selected Indicators")
18
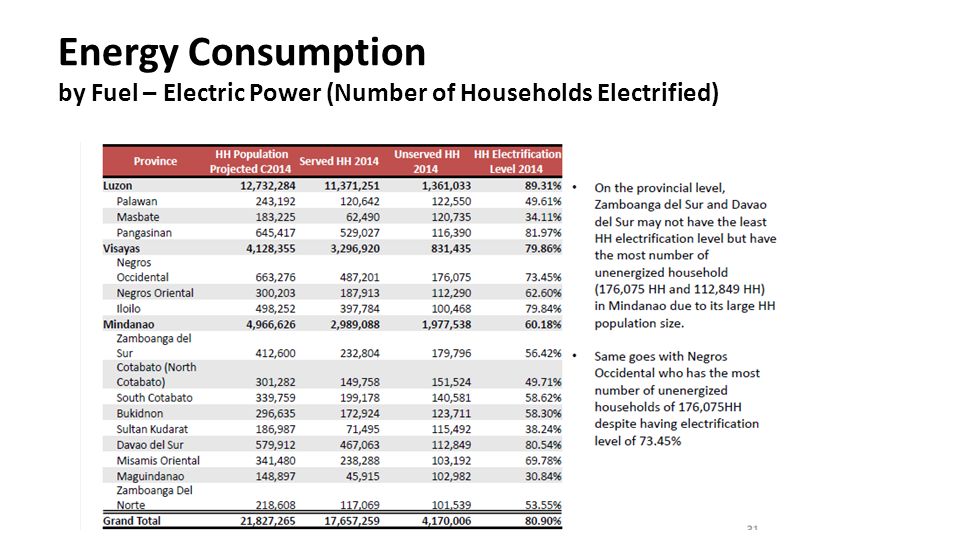
Energy Consumption by Fuel – Electric Power (Number of Households Electrified)
")
20
199019952000200520102013AAGR Electricity Gen/GDP (Wh/Php) 9.89 11.27 12.65 12.62 11.88 11.130.5% Electricity Con/Capita (kWh/capita) 348.11 388.74 477.82 531.64 596.82 632.422.6% Energy Consumption by Fuel – Electric Power (Indicators)
 % Electricity Con/Capita (kWh/capita) % Energy Consumption by Fuel – Electric Power (Indicators)")
21
Ensure Energy Security Expand Energy Access Promote Low-Carbon Future Climate Proof the Energy Sector Develop Regional Energy Plans Evaluate Connection with ASEAN Energy Infrastructure Energy Programs Policy Thrusts

Similar presentations
 J.-F. Hake Facing the truth: EU energy policy.>")

 Year1986198719881989199019911992199319941995199619971998.>")
 for low-carbon end-use sectors in Azerbaijan Chingiz Mammadov UNDP.>")


