Download presentation
Presentation is loading. Please wait.

1
Biomes Under Pressure Forests and woodlands Tropical forests Oceans
Coral reefs and mangroves

2
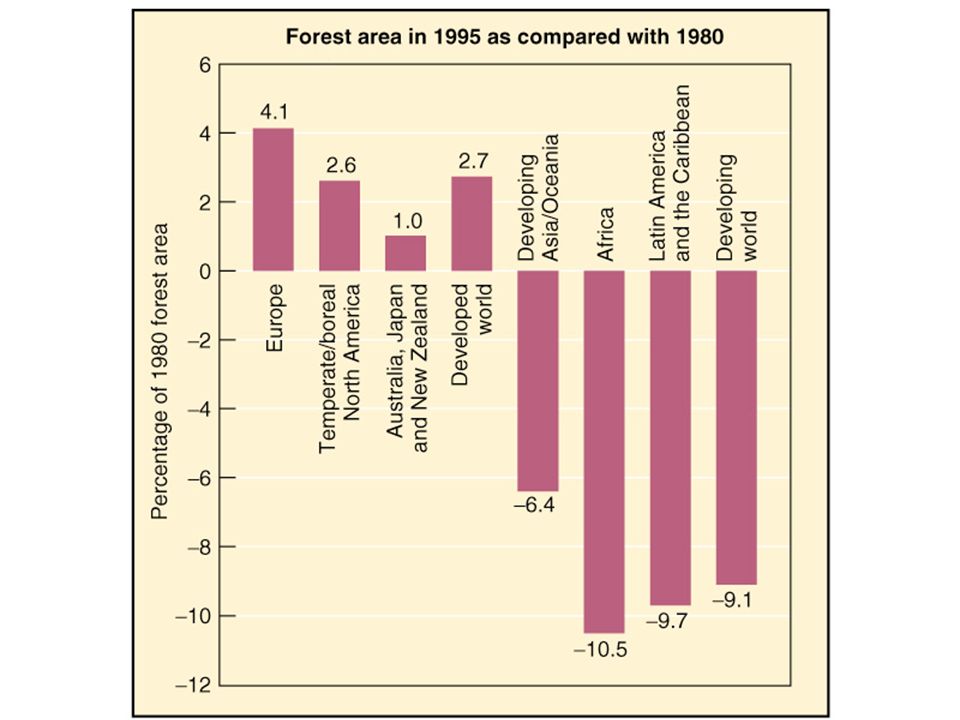
World Wood Consumption

3
Causes of Deforestation
Economic development Human population growth

4
Frontier Forests 8,000 Years Ago
Global Forest Watch PowerPoint Slide #3: Frontier Forests 8,000 Years Ago Here is a bit of history about Global Forest Watch. In 1997, the World Resources Institute published The Last Frontier Forest, Ecosystems and Economies on the Edge. This publication documented for the first time how much forest originally covered the Earth, how much we have lost, and where natural intact tracks of forests – frontier forests – exist today. Frontier Forest = “Old Growth” Forest, which never having been cut down and cleared by humans, they are in balance with natural disturbance events such as fire, winds, etc…

5
Frontier Forests Today
Global Forest Watch PowerPoint Slide #4: Frontier Forests Today This study found that almost ½ of the Earth’s original forest cover is gone, and that only 1/5 of the original cover remains as frontier forests. – forests large enough to sustain large populations of indigenous species even when faced with natural disasters such as fire and storms. Very few forests remain untouched by humans and our practices of large scale clearing for wood and agriculture lands.

6
North American Frontiers
Low or no threat Medium or high threat Non frontier forests Unassessed for threat Non-Frontier Forest are also called “Second Growth” Forests, meaning they have growth back at after at least one clearing.

8
Global Forest Watch PowerPoint Slide #6: Global Forest Watch Reports and Web site
Global Forest Watch was launched at the National Press Club in Washington, DC on February 29, This event featured representatives from Global Forest Watch chapters and included the release of our first three publications as well as our Web site, .

9
Cameroon in 1959 Man wants more farmland for livestock and crops.
Non-Forest Unprotected Forest Protected Forest Logged or Logging Global Forest Watch PowerPoint Slide #10 : Cameroon Logging Concessions in 1959 These forests have been opened up at a rapid pace. Here is a map showing logging concessions in Cameroon in 1959. The logging concessions are shown in purple. The dark green indicates the location of protected areas. The light green shows forest area as of the early 1990s.

10
Cameroon in 1971 Non-Forest Unprotected Forest Protected Forest
Logged or Logging Global Forest Watch PowerPoint Slide #11 : Cameroon Logging Concessions in 1971 Here is a map showing logging concessions in Cameroon in 1971. You can see that there were many more concessions. In the lower left-hand corner (the south eastern part of the country), a logging concession had been allocated inside a protected area.
, a logging concession had been allocated inside a protected area.")
11
Cameroon in 1995 Non-Forest Unprotected Forest Protected Forest
Logged or Logging Global Forest Watch PowerPoint Slide #12 : Cameroon Logging Concessions in 1995 By 1995, most of Cameroon’s forest area had been allocated as logging concessions. These concessions almost surround a protected area in the south central part of the country. A logging concession had also been allocated in a protected area in the southeastern corner.

12
Cameroon in 1999 Today, 80% of Cameroon’s Unprotected Forests are in Logging Areas or Concessions Non-Forest Unprotected Forest Protected Forest Logged or Logging Global Forest Watch PowerPoint Slide #13 : Cameroon Logging Concessions in 1999 Here is the situation in 1999. Today, more than 80 percent of unprotected forest has been, or is slated for logging. Much of this logging and other development has occurred within the past decade. In Gabon, Global Forest Watch has documented similar trends. There, the logging concession area has doubled during the last five years.

13
Affects of Deforestation (Clear Cutting)
Loss of forests leads to: Productivity Nutrient recycling Biodiversity Soil erosion Evapotranspiration Air pollution More or Less

14
Sustainable Forest Management
Manage for sustainable outcomes Responsible practices (teach others) Protect the health of the forest Recognize and protect unique forest ecosystems. Continuous improvement (strive to be better forest managers; be adaptive)
 Protect the health of the forest. Recognize and protect unique forest ecosystems. Continuous improvement (strive to be better forest managers; be adaptive)")
15
New Forestry Practices
Cut trees less frequently Leave wider buffer zones along waterways Leave dead logs and debris Protect broader landscapes Build no new roads until damage to old ones is addressed Added-value products (use of species other than wood/lumber species)
")
16
Loss of Tropical Rainforests – Why?
Colonization: consolidation of agricultural lands Huge national debts Fast food chains and cheap hamburger

17
Conserving Tropical Rainforests
Ecotourism Extractive reserves & Value-added products Management by indigenous people Rubber, coffee & cocoa plantations Sustainable logging Carbon sequestration credits

18
Ocean Ecosystems 75% of the Earth’s surface An international commons?

19
Global Fish Harvests 100 million metric tons of
Overfishing one species leads to shift to catch other less desirable species elsewhere. 100 million metric tons of food on a sustained basis?

20
Fisheries Problems Too many boats High technology Too few fish

21
Magnuson-Stevens Fishery Conservation and Management Act 1976
Gave federal government authority to manage fisheries Claimed the area between 3 and 200 miles off shore as the “Exclusive Economic Zone” Designed to eliminate foreign fishing Designed to restore and conserve fish

22
Impacts of Magnuson-Stevens Act
Swapped foreign with American exploiters Huge conflict of interest among council members Endangerment of 236 fish species

23
Fisheries in Distress Georges Bank Cod Fishery Collapse: Regional management council versus NMFS, an example of regional politics over sound science in late 1970’s; 197 dramatic solutions = half-time, 2/3 area fished; buy-out program.

24
Sustainable Fisheries Act
The 1996 reauthorization of the Magnuson Act. Mandates that fish stocks be rebuilt (reestablished) Management plans and yields be based on sound scientific data Steps be taken to minimize “by-catch”
 Management plans and yields be based on sound scientific data. Steps be taken to minimize by-catch")
25
Mangrove Forest: trees adapted to saltwater and flooded soils.

26
Mangroves Protects coasts from storm damage and erosion
Forms rich refuge and nursery for marine fish Prevents sediments and excess nutrients getting to Coral Reefs Shrimp farming and residential development are leading causes of clearing.

28
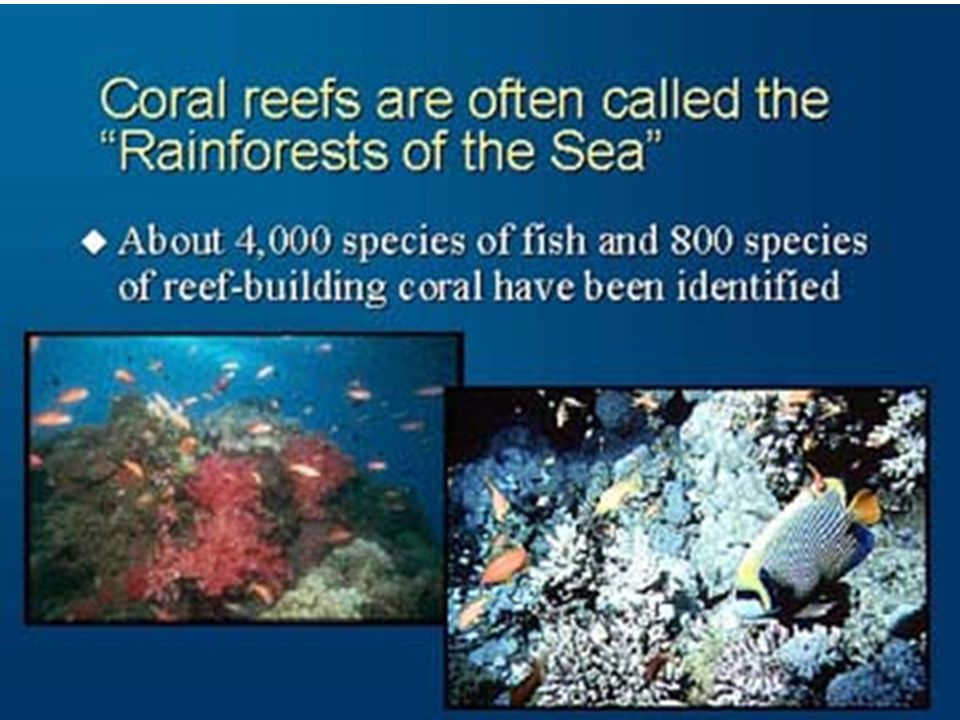
Coral Reefs as Resources for Man:
Important food sources for local people Wave erosion control Great diversity of marine vertebrates and invertebrates

29
Sources of Damage to Coral Reefs:
Climate Change Warmer waters (Coral Bleaching Hot Spots) Sedimentation and Eutrophication Coastal development Shrimp aquaculture Logging Over-Fishing Islander poverty Northern Demand Habitat Destruction/Alteration “Loving it to death” anchor and diver damage
 Sedimentation and Eutrophication. Coastal development. Shrimp aquaculture. Logging. Over-Fishing. Islander poverty. Northern Demand. Habitat Destruction/Alteration. Loving it to death anchor and diver damage.")
30
Marine Sanctuaries [Photo: Northwestern Hawaiian Islands Coral Reef Ecosystem Reserve]
![Marine Sanctuaries [Photo: Northwestern Hawaiian Islands Coral Reef Ecosystem Reserve]](http://slideplayer.com/slide/9449674/29/images/30/Marine+Sanctuaries+%5BPhoto%3A+Northwestern+Hawaiian+Islands+Coral+Reef+Ecosystem+Reserve%5D.jpg "Marine Sanctuaries [Photo: Northwestern Hawaiian Islands Coral Reef Ecosystem Reserve]")
31
Belize Case Study About 70% Forest Remains
Second largest barrier reef in the world. Tourism industry matches sugar Cane production as leading industry and revenue generator in Belize. Approximately 45% of land area as park, reserves, or private land trusts. Numerous marine sanctuaries!

Similar presentations