Download presentation
Presentation is loading. Please wait.

1
T EAM C ACHE M ONEY : S OLAR I NSOLATION F ORECASTING P RELIMINARY D ESIGN R EVIEW B. DiRenzo, L. Hager, A. Fruge, M. Dickerson, C. Duclos, N. Frank, T. Furlong

2
O UTLINE Objectives Background System Overview Primary Use Case High Level Functional Decomposition Risks and Contingencies Division of Labor Budget Milestones B. DiRenzo

3
O BJECTIVES Create an inexpensive, real-time, and accurate solar insolation forecasting map. Targeted for use by power companies to efficiently stabilize the power grid with solar generated energy. Make large scale use of PV arrays more feasible and reliable. B. DiRenzo

4
B ACKGROUND Up to 40% of power can be supplied by solar energy (eg Hawaii). Cloud cover creates major drop-off in energy production. Leads to grid being unstable. Similar methods exist for wind energy. Unreliability limits use of on-grid PV arrays. B. DiRenzo

5
P OWER O UTPUT (W) F ROM A PV A RRAY ON A C LOUDY D AY VS. A S UNNY D AY *PV data provided by Professor Gasiewski L. Hager

6
S YSTEM O VERVIEW Remote smart-phone sensors Transmits photos of cloud coverage On-grid PV array power sensors Transmits real-time power measurements Localized server Parses data and computes forecast using cloud motion vectors in real-time Generates insolation forecast map with error bars L. Hager

7
P RIMARY U SE C ASE Power Engineer seeks to use the final GUI application to make smart decisions about how the power company will generate power in the near future. Engineer may also want to look back on past predictions to compare with actual solar statistics. T. Furlong

8
H IGH L EVEL D ESIGN T. Furlong

9
F UNCTIONAL D ECOMPOSITION L EVEL 0 T. Furlong

10
F UNCTIONAL D ECOMPOSITION : L EVEL 1 T. Furlong

11
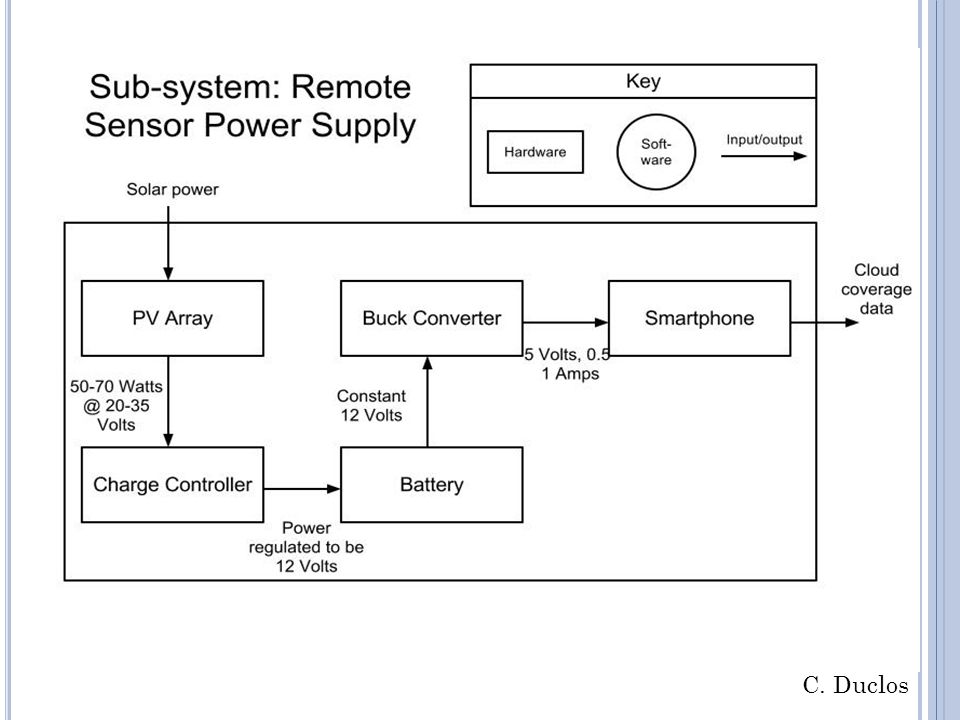
L EVEL 2 S UB -S YSTEM : R EMOTE S ENSOR A. Fruge

12
L EVEL 2 S UB -S YSTEM : O N -G RID PV S ENSOR A. Fruge

13
L EVEL 2 S UB -S YSTEM : S ERVER Database: Saves forecast map and inputs appropriate forecast data to map creator Network: Receives data from sensors and inputs to appropriate location GUI: Receives user input and displays appropriate forecast map Receives Data Image Processor: Determines cloud motion vectors and sends to forecaster Forecaster: Creates forecast map every minute, using data received and updates database Inputs cloud images Inputs power measurements Inputs motion vectors Inputs forecast data Inputs forecasting map User inputs, then GUI displays to user Cloud images Residential power measurement s Map Creator: Receives forecasting data and outputs forecasting map to GUI Inputs forecast data Inputs requested map data C. Duclos

15
Due to lack of sunlight, Remote Sensor may lose power. – Battery is chosen to be large enough to power the sensor for up to 4 days with no sunlight. Due to lack of network coverage, data from Remote Sensor may not be transmitted in real time or at all. – Program will be able to compensate for an incomplete data set through the error calculations. R ISKS AND C ONTINGENCIES M. Dickerson

16
Camera lens may have obstructions preventing pictures from obtaining accurate cloud data. – Software will be able to tell the difference between obstructions and clouds. – Protective casing will mitigate the amount of debris that will be able to cover the lens. Direct sunlight may cause CCD array to be burned, and therefore lose image quality or create “blind spots” on images. – Protective lens filter will ensure minimal damage to the CCD array. R ISKS AND C ONTINGENCIES C ONTINUED M. Dickerson

17
D IVISION OF L ABOR JobOwner(s) Remote smartphone sensor B. DiRenzo, A. Fruge On-Grid PV ArrayL. Hager, N. Frank Localized ServerC.Duclos, T. Furlong Power SystemsM. Dickerson Chief Financial OfficerL. Hager N. Frank

18
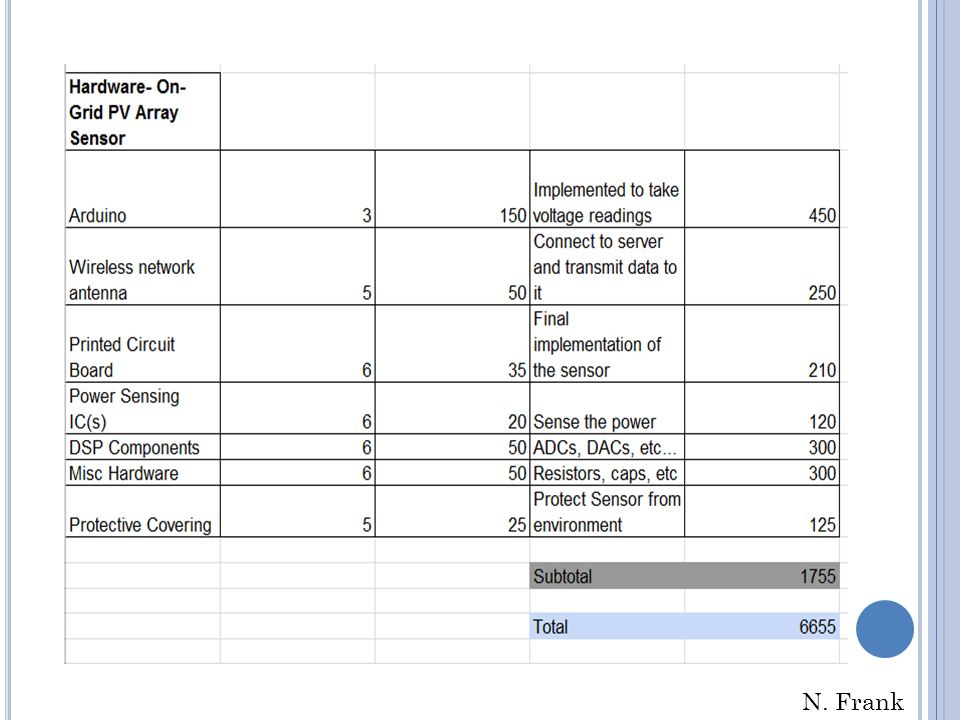
B UDGET N. Frank

20
F IRST S EMESTER M ILESTONES N. Frank

21
S ECOND S EMESTER M ILESTONES N. Frank

22
T HE E ND

Similar presentations


 SDMAY 12-24 Advisor: Dr. Venkataramana Ajjarapu.>")


