Download presentation
Presentation is loading. Please wait.

1
Colin Jones and Michael White
Property Booms and Busts: Retail Property and Office Yield Trends Compared Colin Jones and Michael White

2
Introduction Downturn following credit crunch saw investment funds dramatically dry up. Impact saw first yields rise then fall in development as it became unviable and unfundable, then rents fell Aftermath credit crunch highlights role of external influences Increase attention in the concept of asset bubbles This paper examines the contribution of bubbles by an analysis of urban office and retail yields It makes a comparison between these two property sectors

3
Office and Retail Yields: London

4
Office and Retail Yields: Edinburgh

5
Bubbles or Cycles Term ‘bubble’ is inconsistent with the concept of efficient markets Notion of a bubble creates another debate about its relationship with the cyclical behaviour of real estate markets Can speculative bubbles occur independently of property cycles or do they amplify cycles? Potential for bubbles in real estate markets given inefficiencies

6
Existing Research Extended period of house price inflation across the world in the 1980s and especially from the mid 1990s stimulated academic studies Tested whether these trends can be justified by reference to fundamentals Only one by Hendershott (2000) of Sydney, Australia, has examined commercial property 11 years study period over one cycle Approach = deviations of a fundamental value to replacement cost ratio and requiring an independent forecast of vacancy rates. Conclusions suggest the existence of a bubble
 of Sydney, Australia, has examined commercial property. 11 years study period over one cycle. Approach = deviations of a fundamental value to replacement cost ratio and requiring an independent forecast of vacancy rates. Conclusions suggest the existence of a bubble.")
7
Property and Business Cycle
Capital investment as the key cyclical driver of economic growth New development = key influence on the business cycle Occupation demand is linked to business cycle Property market is inevitably cyclical But there is a further factor - development time lags

8
Stylised Commercial Cycles
Development lags amplify economic cycle Studies conceptualised the property cycle by reference to the 'cobweb model' and the role of development lags Different types of real estate have different cycles reflecting different development lags

9
Barras Model

10
Internal Dynamics of Cycles
Cycles amplified by internal mechanics Valuers or surveyors tend to over-price in booms (under-price in downturns) Pressures by developers to support their decisions based on current values or expected values derived from extrapolating the past Investment demand/ development via adaptive expectations –> prices beyond fundamentals Supporting element in this process is akin to a Ponzi scheme in that new investors/developers are attracted by the profits made by first investors
 Pressures by developers to support their decisions based on current values or expected values derived from extrapolating the past. Investment demand/ development via adaptive expectations –> prices beyond fundamentals. Supporting element in this process is akin to a Ponzi scheme in that new investors/developers are attracted by the profits made by first investors.")
11
continued Processes can operate in reverse direction Simplification
Banks financing development also support these processes and display lack of caution in upturns Arguably a collective under-pricing of risk Consequences are that construction /development activity at peak of the cycle becomes too “high” and unsustainable Downturn or slump is also greater

12
Bubble Processes Mechanisms overshoot price fundamentals -> a bubble Parallels with bubble processes identified in financial asset markets Shiller -> bubbles driven by feedback loop theory -> exogenous shocks instigate price increases encouraging further investment demand through adaptive expectations. Property studies centre on housing - bubble as abnormal Shiller in the latter sees the bubble as a normal phenomenon/cycle - an exaggerated cycle

13
Bubbles Smith and Smith (2006) define a bubble as “a situation in which the market prices of certain assets (such as stocks or real estate) rise far above the present value of the anticipated cash flow from the asset” The rapid price rise brings speculative activity on expectations of future price increases rather than focusing on the asset’s cash flow or fundamental factors driving the market. In practice it may prove difficult to identify bubbles. Protagonists of bubbles implicitly assume that prices were equal to fundamental values historically before a period of rapid asset price inflation. Opponents argue that observed prices may have been too low and that increasing prices may have (at least in part) reflected an adjustment process towards long run equilibrium values.
 define a bubble as a situation in which the market prices of certain assets (such as stocks or real estate) rise far above the present value of the anticipated cash flow from the asset The rapid price rise brings speculative activity on expectations of future price increases rather than focusing on the asset’s cash flow or fundamental factors driving the market. In practice it may prove difficult to identify bubbles. Protagonists of bubbles implicitly assume that prices were equal to fundamental values historically before a period of rapid asset price inflation. Opponents argue that observed prices may have been too low and that increasing prices may have (at least in part) reflected an adjustment process towards long run equilibrium values.")
14
Argument Unlike asset bubbles instigated by exogenous shocks property cycles driven by internal lags Shiller’s model of a bubble incorporating endogenous feedback driven by adaptive expectations = generic ‘cyclical’ model ‘Barras’ cycle is special case that adds time lags ‘Bublical’ model is assymetrical Bubbles are not one off occurrences but are a natural part of property cycles but that the adaptive expectations processes of amplification are greater in the upturn than the downturn

15
Empirical Research Continuous dynamic price system can be decomposed into a fundamental and bubble component with former present value of future income Himmelberg et al (2005) approach - examine housing bubbles via a ‘user cost’ approach Assess whether property is over or under valued Essentially user cost if a function of the risk free rate of borrowing, expected capital value change (and income growth for commercial property) plus a risk premium Property taxes etc assumed zero
 approach - examine housing bubbles via a ‘user cost’ approach. Assess whether property is over or under valued. Essentially user cost if a function of the risk free rate of borrowing, expected capital value change (and income growth for commercial property) plus a risk premium. Property taxes etc assumed zero.")
16
Some detail Within this framework in long run equilibrium capital value to income ratio should equal the inverse of the user cost, ie initial yield Dunse et al (2007) model extended - link to real property market via inclusion of key demand variable, finance and business services output Property markets are taken to be essentially urban with different rent cycles and have different associated risk. Based on the office markets of British cities over the period City level property data from IPD & SWIP
 model extended - link to real property market via inclusion of key demand variable, finance and business services output. Property markets are taken to be essentially urban with different rent cycles and have different associated risk. Based on the office markets of British cities over the period City level property data from IPD & SWIP.")
17
Model Overall yield model can therefore be rewritten as
IY = f (ΔRRVI, GY, LEP, EA) GY = return on long dated gilts and LEP = average yield on the FTSE 100 index, ΔRRVI =current real rental growth Equation models Barras model although development lags are not explicit, implicit in expected rental growth Model is extended to include market fundamentals capturing the economic activity (EA) by value of finance and business services output (FBO) for offices and GDP or consumers expenditure for retail Estimated by panel time series multiple regression in logarithmic form. Long run equilibrium models for the cities
 GY = return on long dated gilts and LEP = average yield on the FTSE 100 index, ΔRRVI =current real rental growth. Equation models Barras model although development lags are not explicit, implicit in expected rental growth. Model is extended to include market fundamentals capturing the economic activity (EA) by value of finance and business services output (FBO) for offices and GDP or consumers expenditure for retail. Estimated by panel time series multiple regression in logarithmic form. Long run equilibrium models for the cities.")
18
Logic of Results Fundamentals and expectations for yields are captured from the model Remaining mispricing may be attributed to a ‘bubble’ Following estimation of this model, fitted values were calculated for each city Proportionate difference between actual yields in each city and those estimated from model Greater difference then larger over- or under- pricing of office real estate

19
Office Market

20
Retail Market

21
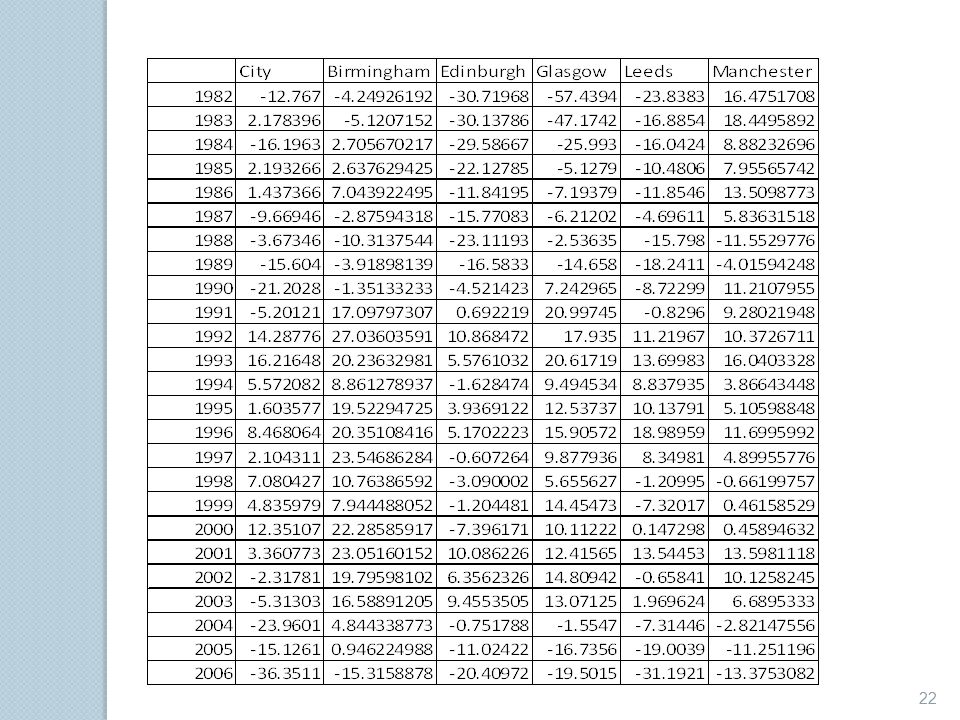
Percentage Differences between Actual and Estimated Office Yields for Individual Cities 1981-2006

23
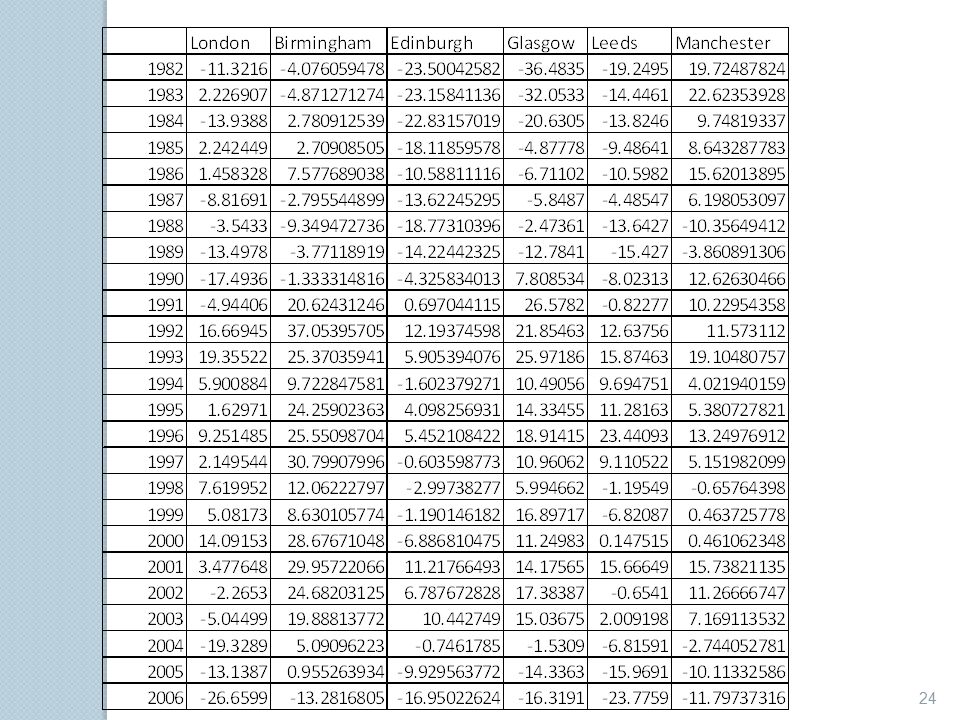
Percentage Differences between Actual and Estimated Retail Yields for Individual Cities 1981-2006

25
Commentary Late ‘80s London more susceptible to bubble effects but overpricing across markets Actual prices rising above fundamentals towards the end of the time period before financial crisis – apparent in both office and retail sectors and across cities Clear individual patterns over time presumably reflecting localised demand and supply expectations Asymmetry in these effects is perhaps less straightforward

26
Conclusions Empirical analysis shows substantial and systematic cyclical bubble effects Prices will always be ‘over-priced’ in a boom and ‘underpriced’ in a bust Differences in time lags between office and retail did not seem to significantly affect results Hence traditional exposition of the property cycle with its time lags needs to be augmented to encompass such ‘bubble’ effects Barras property cycle as a special case that adds time lags to a more generic model of cycles centring on adaptive expectation stimulated by external shocks But careful interpretation needed as further analysis required to improve model performance

Similar presentations

, Oliver Holtemöller (Halle Institut for Macroeconomics)>")


>")


>")


