Download presentation
Presentation is loading. Please wait.

1
LINEAR EQUATIONS & THEIR GRAPHS CHAPTER 6

2
INTRODUCTION We will explore in more detail rates of change and look at how the slope of a line relates to this rate of change. We will continue to discuss graphing and graph linear equations and express them in three different forms, using the slope, intercepts, or points on the line. We will examine the characteristics of parallel and perpendicular lines. We will generate and explore the meaning of trend lines. We will learn how to graph absolute value equations.

3
RATE OF CHANGE AND SLOPE (6.1) Rate: A ratio that compares two different quantities (Section 4.1) Rate of change: This rate allows us to see the relationship between two quantities that are changing. If in this ratio, one quantity depends on the other, then the following equality is true:

4
RATE OF CHANGE AND SLOPE (6.1) Sample Problem For the data at the left, is the rate of change for each pair of consecutive days the same? Number of Days Rental Charge ($) 160 275 390 4105 5120 Cost of Renting a Computer
 Cost of Renting a Computer.")
5
RATE OF CHANGE AND SLOPE (6.1) We can plot the ordered pairs of a relation to find the rate of change. Again the independent variable (the input values) should be graphed on the x-axis. The dependent variables (the output values) should be plotted along the y-axis. When this is done the rate of change will take the following form:
 should be graphed on the x-axis. The dependent variables (the output values) should be plotted along the y-axis. When this is done the rate of change will take the following form:.")
6
RATE OF CHANGE AND SLOPE (6.1) This is the graph of the ordered pairs in the table above. All the points lie on a straight line representing the rate of change of cost per day. The data is considered linear.

7
RATE OF CHANGE AND SLOPE (6.1) To find the rate of change using a graph: Pick two points that lie on the line. Subtract the y-values (the ranges). Subtract the x-values (the domains). Divide the difference in the range by the difference in the domain to get the rate of change.
. Subtract the x-values (the domains). Divide the difference in the range by the difference in the domain to get the rate of change..")
8
RATE OF CHANGE AND SLOPE (6.1) Sample Problem Find the rate of change from the following graph.
 Sample Problem Find the rate of change from the following graph.")
9
RATE OF CHANGE AND SLOPE (6.1)
")
10
Sample Problem Find the slope of the following line.

11
RATE OF CHANGE AND SLOPE (6.1) We can also solve for the slope of a line using two points on a line. Remember that the x-coordinate that is used first in the denominator must belong to the same ordered pair as the y-coordinate you use in the numerator. Sample Problem Find the slope of the line through A(-2,1) and B(5,7).
 and B(5,7)..")
12
RATE OF CHANGE AND SLOPE (6.1) The slopes of horizontal and vertical lines.
 The slopes of horizontal and vertical lines.")
13
RATE OF CHANGE AND SLOPE (6.1) Summarizing the slopes of lines.
 Summarizing the slopes of lines.")
14
SLOPE-INTERCEPT (6.2) Linear equation: An equation whose graph is a line. Functions can be linear. y = 2x + 5 Not all equations are linear though. y = x 2 Y-intercept: The y-coordinate of the point where a line crosses the y-axis. Knowing the y-intercept and the slope of a line will allow us to write the equation for the line. Slope-intercept Form of a Linear Equation y = mx + b

15
SLOPE-INTERCEPT (6.2) Sample Problem Identify the slope and y-intercept for the following equation: y = 3x – 5.
 Sample Problem Identify the slope and y-intercept for the following equation: y = 3x – 5.")
16
SLOPE-INTERCEPT (6.2) If given the slope and the y-intercept, we can write a linear equation using the slope-intercept form of a linear equation.
 If given the slope and the y-intercept, we can write a linear equation using the slope-intercept form of a linear equation.")
17
SLOPE-INTERCEPT (6.2) You can use a graph to derive a linear equation as well. Use two points from the graph. Find the slope. Use the slope and the y-intercept to write the equation (remember: the y-intercept is the pair with the x-value of 0).
..")
18
SLOPE-INTERCEPT (6.2) Sample Problem Write the equation for the line in the following graph.
 Sample Problem Write the equation for the line in the following graph.")
19
SLOPE-INTERCEPT (6.2) Each point on the graph of an equation is an ordered pair that makes the equation true. The graph of a linear equation is a line that indicates all the solutions of the equation. Therefore, we can use the slope and the y-intercept to graph a line.

20
SLOPE-INTERCEPT (6.2) Sample Problem Graph the following equation, y = 3x – 1.
 Sample Problem Graph the following equation, y = 3x – 1.")
21
STANDARD FORM (6.3) The slope-intercept form is just one form of a linear equation. The standard form is another form. The standard form is useful in making quick graphs.

22
STANDARD FORM (6.3) We can find the x-intercept and the y-intercept from the standard form. The x-intercept is the point where the line crosses the x- axis. To find the x-intercept from the standard form equation: Take the standard form and substitute 0 in for y. Solve for x. Use the same method to find the y-intercept. With the x-intercept and the y-intercept we can graph an equation in standard form.

23
STANDARD FORM (6.3) Sample Problem Find the x- and y-intercept of 3x + 4y = 8.
 Sample Problem Find the x- and y-intercept of 3x + 4y = 8.")
24
Sample Problem Graph 2x + 3y = 12 using the intercepts. STANDARD FORM (6.3)
")
25
x =0 because A=0 y =0 because B=0

26
STANDARD FORM (6.3) We can change an equation from the slope-intercept form to the standard form. First, multiply or divide to take care of fractions or decimals, if they are present. Then group the variables on one side.

27
POINT-SLOPE FORM AND WRITING LINEAR EQUATIONS (6.4) If we are given a point through which a line passes and we know its slope, we can quickly write an equation of the line using the x- and y-coordinates of the point and using the slope. This equation is known as the point-slope form.

28
POINT-SLOPE FORM AND WRITING LINEAR EQUATIONS (6.4) Sample Problem Write the equation of the line with the slope 2 that passes through the point (3,4).
 Sample Problem Write the equation of the line with the slope 2 that passes through the point (3,4).")
29
POINT-SLOPE FORM AND WRITING LINEAR EQUATIONS (6.4) If we are given two points on a line, we can still obtain the point-slope equation. Use the two points to calculate for the slope. Use this slope and one of the two points to write the point-slope equation.

30
POINT-SLOPE FORM AND WRITING LINEAR EQUATIONS (6.4) Sample Problem Write the point-slope equation and the slope-intercept equation for line using points A and B.
 Sample Problem Write the point-slope equation and the slope-intercept equation for line using points A and B.")
31
POINT-SLOPE FORM AND WRITING LINEAR EQUATIONS (6.4) We can write a linear equation to model data in tables. Two sets of data have a linear relationship if the rate of change between consecutive pairs of data is the same. This rate of change will be the slope. XY 4 36 57 1110 What is the rate of change between consecutive pairs? Are they the same for all pairs? What is the slope then? Write the point-slope equation for these data points.

32
PARALLEL AND PERPENDICULAR LINES (6.5) Parallel lines: Lines that are in the same that never intersect. We can use the slope-intercept form of equations to determine whether two lines are parallel. Slopes of Parallel Lines Non-vertical lines are parallel if they have the same slope and different y-intercepts. Any two vertical lines are parallel.

33
PARALLEL AND PERPENDICULAR LINES (6.5)
")
34
We can use the Property of the Slopes of Parallel Lines to write an equation of a line parallel to a given line. To do this we will use the slope of the given line and the point-slope form of a linear equation.

35
PARALLEL AND PERPENDICULAR LINES (6.5) Perpendicular lines: Lines that intersect to form right angles. The product of two numbers is -1 if one number is the negative reciprocal of the other. We can use the negative reciprocal of the slope of a given line to write an equation of a line perpendicular to that line. Slopes of Perpendicular Lines Two lines are perpendicular if the product of their slopes is -1. A vertical and horizontal line are also perpendicular.

36
PARALLEL AND PERPENDICULAR LINES (6.5) Sample Problem Find the equation of the line that contains (0,-2) and is perpendicular to y =5x +3.
 Sample Problem Find the equation of the line that contains (0,-2) and is perpendicular to y =5x +3.")
37
SCATTER PLOTS AND EQUATIONS OF LINES (6.6) The trend line (Section 1.9) that shows the relationship between two sets of data most accurately is called the line of best fit. A graphing calculator can compute the equation of a line of best fit by using a method called linear regression. Correlation coefficient (r): A number which tells us how closely the equation models the data. The graphing calculator (or graphing program) can also give us this information. When the data cluster around a line, there is a strong correlation between the line and the data. The nearer “r” is to 1 or -1 the better the correlation.
: A number which tells us how closely the equation models the data. The graphing calculator (or graphing program) can also give us this information. When the data cluster around a line, there is a strong correlation between the line and the data. The nearer r is to 1 or -1 the better the correlation..")
38
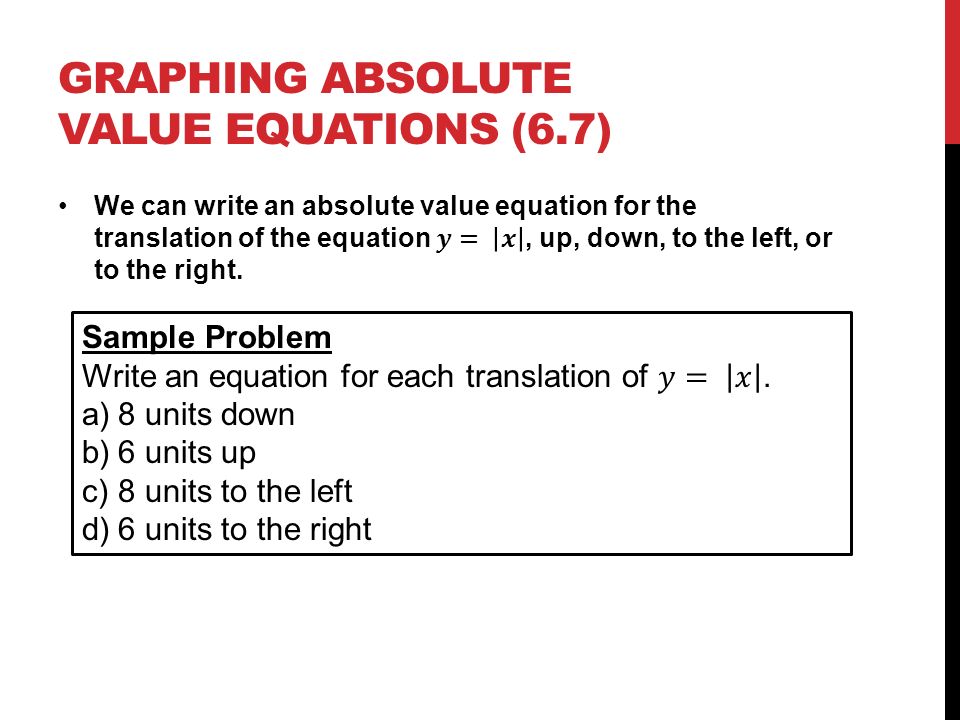
GRAPHING ABSOLUTE VALUE EQUATIONS (6.7) In section 5.3 we saw that the graph for an absolute value equation is a V—shaped graph that points upward or downward. We can translate an absolute value graph. Translate: The shifting of a graph horizontally, vertically, or both. The result is a graph of the same shape and size, but in a different position.

39
GRAPHING ABSOLUTE VALUE EQUATIONS (6.7)
")
42
LINEAR EQUATIONS & THEIR GRAPHS CHAPTER 6 THE END

Similar presentations