Download presentation
Presentation is loading. Please wait.

1
TEXTURAL CHARACTERIZATION OF CATALYSTS A.V RAMASWAMY Email: av_ram@hotmail.com Presentation at SABIC Technology Center 5 August 2015

2
A GENERAL INTRODUCTION TO SOLIDS AND CATALYSTS 1.CATALYSTS USED ARE ESSENTIALLY OR INVARIABLY SOLIDS 2. REACTANTS ARE EITHER LIQUID, GAS OR BOTH The immediate problem: Bringing them together from different phases - Interfacial phenomenon - inter and intra-particle diffusion (D external and D internal ) - Mass transfer and heat transfer Catalysts are Inorganic materials: - Metal complexes or organometallics in homogeneous catalysis - Oxides, sulfides, metals constitute most of the solids used in heterogeneous catalysis
 - Mass transfer and heat transfer Catalysts are Inorganic materials: - Metal complexes or organometallics in homogeneous catalysis - Oxides, sulfides, metals constitute most of the solids used in heterogeneous catalysis.")
3
OXIDES How do we define the role of oxides as catalysts Classify Chemically as acidic, basic, neutral or amphoteric defines the intrinsic property of the material Many physical classificationsNon-porous (condensed) Porous AmorphousCrystalline- Micro - Meso - Macro Textural -big- monoclinic - small- orthorhombic - Nano- cubic, etc. (size)(long-range order of arrangements of atoms)Structural Influenced by Method of preparation, Temperature, Pressure and Time
(long-range order of arrangements of atoms)Structural Influenced by Method of preparation, Temperature, Pressure and Time.")
4
Examples: Alumina:Transition aluminas: - - - - → -alumina Titania:Anatase and Rutile Zirconia:Monoclinic, tetragonal and cubic forms Silica: At least 12 different forms→ -quartz → - → -tridymite → - → -cristobalite → - Silica gel Within the solid phase, the transformations are dependent on the temperature and pressure Ostwald’s law of successive transformations, limited by thermodynamics

5
THE PURPOSE AND THE MOTIVATION WHY DO WE NEED TO CHARACTERIZE A CATALYST AS LONG AS IT IS ACTIVE IN A PARTICULAR REACTION? SHOULD WE CHARACTERIZE THE SURFACE OF A SOLID CATALYST OR THE BULK OF THE CATALYST? WHAT ARE THE IMPLICATIONS IN CHARACTERIZING A POROUS MATERIAL?

6
HOW DO WE LINK PROPERTIES OF MATERIALS WITH CATALYSIS WE WANT TO IDENTIFY THE ACTIVE SITES - IN MONOFUNCTIONAL CATALYSTS - IN BIFUNCTIONAL CATALYSTS DEFINE: THE NATURE AND ENVIRONMENT OF THE ACTIVE SITE ESTIMATE THE NUMBER OF ACTIVE SITES TURN OVER NUMBER ?

7
HOMOGENEOUS CATALYSIS WITH ORGANO METALLIC COMPLEXES Predicting the properties of metal complexes and catalysts: Synthesis and characterization Quantitative Analysis of Ligand Effects (QALE) using electronic and steric parameters, viz., - and θ of metal complexes in a quantitative manner in linear free energy relationships (LFER) Tolman’s equation: Property = a + b( ) + c θ The property could be log of rate constant, equilibrium constant, etc.
 using electronic and steric parameters, viz., - and θ of metal complexes in a quantitative manner in linear free energy relationships (LFER) Tolman’s equation: Property = a + b( ) + c θ The property could be log of rate constant, equilibrium constant, etc.")
8
Refinements: Property = a + b ( ) + c(θ – θ th ) where,, the switching factor, reads 0 below the threshold and 1 above it. Refinement of the electronic parameter: Property = a( d ) + b(θ – θth) + c(E ar ) + d( p ) + e where d is used for -donocity and p used for -acceptor property; E ar is for “aryl effect”. For reactions having a simple rate equation, the evaluation of ligand effects with the use of methods such as QALE will augment our insight into development of new ligands, a better comparison of related reactions, and a useful comparison between different metals.
 + b(θ – θth) + c(E ar ) + d( p ) + e where d is used for -donocity and p used for -acceptor property; E ar is for aryl effect . For reactions having a simple rate equation, the evaluation of ligand effects with the use of methods such as QALE will augment our insight into development of new ligands, a better comparison of related reactions, and a useful comparison between different metals..")
9
PHYSICO-CHEMICAL PROPERTIES OF SOLID CATALYSTS The chemical composition (AAS, ICP, XRF, etc) The structural properties The geometry, the long range order in a solid: XRD, TEM, and related techniques: examples of a metal oxide, zeolite, supported metals The textural properties The surface area, pore volume, pore size, etc., The mechanical properties Density, attrition, crushing strength, etc.,
 The structural properties The geometry, the long range order in a solid: XRD, TEM, and related techniques: examples of a metal oxide, zeolite, supported metals The textural properties The surface area, pore volume, pore size, etc., The mechanical properties Density, attrition, crushing strength, etc.,")
10
TECHNIQUES FOR THE CHARACTERIZATION OF CATALYSTS 1.Physical adsorption of gases: N 2, Ar, Kr, a) Specific surface area: Langmuir, BET b) Total pore volume and pore volume distribution among pores of different radii 2.Chemisorption of gases: H 2, CO, NH 3, CO 2 a) Metal surface area and dispersion b) Area of active phase, in general c) Acidity d) Isosteric heats of adsorption
 Specific surface area: Langmuir, BET b) Total pore volume and pore volume distribution among pores of different radii 2.Chemisorption of gases: H 2, CO, NH 3, CO 2 a) Metal surface area and dispersion b) Area of active phase, in general c) Acidity d) Isosteric heats of adsorption")
11
TECHNIQUES FOR THE CHARACTERIZATION OF CATALYSTS 3.Mercury Intrusion porosimetry Pore volume and pore size distribution 4.Density measurements a) Skeletal density or true density b) Grain density or particle density c) Bed density or bulk density 5.X-ray line broadening, TEM, Light scattering a) Mean particle size, crystallite size b) Particle size distribution 6.Scanning Electron Microscopy/EDX a) Morphology and Shape b) Spot composition
 Skeletal density or true density b) Grain density or particle density c) Bed density or bulk density 5.X-ray line broadening, TEM, Light scattering a) Mean particle size, crystallite size b) Particle size distribution 6.Scanning Electron Microscopy/EDX a) Morphology and Shape b) Spot composition")
12
TECHNIQUES FOR THE CHARACTERIZATION OF CATALYSTS 7. Temperature-programmed reduction, desorption and reaction a) Reducibility, metal dispersion, etc., b) Strength of active sites (metallic, acidic, basic, etc) c) Energetics of reactions, reactivities, etc., 8. Thermal Analysis: Thermogravimetry, Differential Thermal Analysis, Differential Scanning Calorimetry a) Phase transitions, state of precursors, thermal stability b) Heats associated with phase transitions
 Reducibility, metal dispersion, etc., b) Strength of active sites (metallic, acidic, basic, etc) c) Energetics of reactions, reactivities, etc., 8. Thermal Analysis: Thermogravimetry, Differential Thermal Analysis, Differential Scanning Calorimetry a) Phase transitions, state of precursors, thermal stability b) Heats associated with phase transitions.")
13
TECHNIQUES FOR THE CHARACTERIZATION OF CATALYSTS 9. UV-Vis Diffuse Reflectance Spectroscopy Charge-transfer transitions e.g., Coordination sphere around a metal species 10. FT-IR Spectroscopy a) KBr-pellet Framework vibrations b) Self-supporting wafers and c) Diffuse reflectance IR Fourier Transform (DRIFT) cation vibrations (far IR), heat treatment, vacuum, admit probes, in-situ characterization “Operando Spectroscopy”
 KBr-pellet Framework vibrations b) Self-supporting wafers and c) Diffuse reflectance IR Fourier Transform (DRIFT) cation vibrations (far IR), heat treatment, vacuum, admit probes, in-situ characterization Operando Spectroscopy .")
14
TECHNIQUES FOR THE CHARACTERIZATION OF CATALYSTS 11. NMR Spectroscopy (Solid-state): MAS 27 Al NMR, 29 Si NMR, 31 P, 1 H NMR Framework Si/Al ratio, dealumination 12. ESR Spectroscopy Specific cations, geometry, radicals, 13. X-ray Photoelectron spectroscopy Surface specific, Valence states, binding energy
: MAS 27 Al NMR, 29 Si NMR, 31 P, 1 H NMR Framework Si/Al ratio, dealumination 12. ESR Spectroscopy Specific cations, geometry, radicals, 13. X-ray Photoelectron spectroscopy Surface specific, Valence states, binding energy.")
15
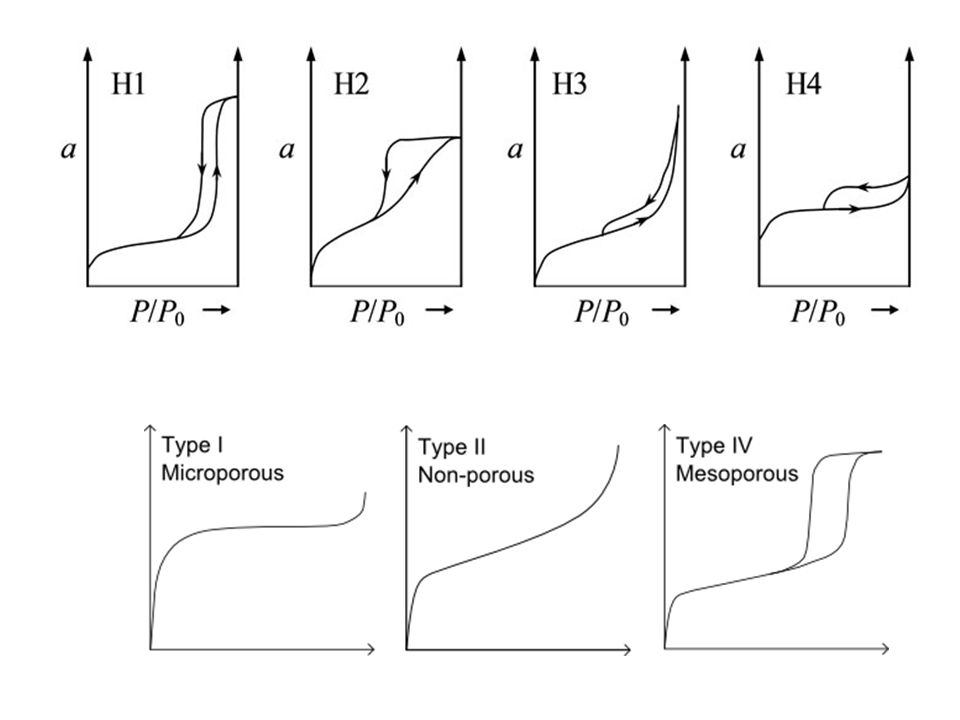
Physical Adsorption of gases on solid materials Weak forces of adsorption between the adsorbent and the adsorbate Choice of adsorbates (gases) Set up appropriate conditions, temperature and pressure for physical Adsorption How do we follow the course of adsorption? Adsorption isotherm Adsorption isochore Essentially two ways or methods for getting an adsorption isotherm - Volumetric method -- Gravimetric method -- Pulse adsorption

23
Types of Hysteresis Large pores/voids Gel Mesopores MCM Volume adsorbed Relative Pressure (P/Po)
")
26
Comparisons Gas Sorption Calculation Methods P/Po rangeMechanismCalculation model 1x10⁻⁷ to 0.02 micropore fillingDFT, GCMC, HK, SF, DA, DR 0.01 to 0.1 sub-monolayer formationDR 0.05 to 0.3 monolayer complete BET, Langmuir > 0.1 multilayer formation t-plot(de-Boer,FHH), > 0.35 capillary condensation BJH, DH 0.1 to 0.5 capillary filling DFT, BJH in M41S-type materials
, > 0.35 capillary condensation BJH, DH 0.1 to 0.5 capillary filling DFT, BJH in M41S-type materials")
27
Different Theories of Physisorption

28
Surface Area Measurements

29
The BET The most famous gas sorption model. Extends Langmuir model of gas sorption to multi-layer. BET equation linearizes that part of the isotherm that contains the “knee”, i.e. that which brackets the monolayer value. Normally solved by graphical means, by plotting 1/(V[(Po/P)]-1) versus P/Po. Monolayer volume (Vm) is equal to 1/(s+i) where s is the slope and i is the y-intercept. Usually BET theory is also applied to obtain the specific surface area of microporous materials, although from a scientific point of view the assumptions made in the BET theory do not take into account micropore filling. Please note, that for such samples the linear “BET” range is found usually at relative pressures< 0.1, in contrast to the classical BET range, which extends over relative pressures between 0.05 – 0.3.
]-1) versus P/Po. Monolayer volume (Vm) is equal to 1/(s+i) where s is the slope and i is the y-intercept. Usually BET theory is also applied to obtain the specific surface area of microporous materials, although from a scientific point of view the assumptions made in the BET theory do not take into account micropore filling. Please note, that for such samples the linear BET range is found usually at relative pressures< 0.1, in contrast to the classical BET range, which extends over relative pressures between 0.05 –")
30
Langmuir Adsorption model limited to the formation of a monolayer that does not describe most real cases. Sometimes can be successfully applied to type I isotherms (pure micropore material) but the reason for limiting value (plateau) is not monolayer limit, but due to micropore filling. Therefore type I physisorption isotherm would be better called “pseudo- Langmuir” isotherm.
 but the reason for limiting value (plateau) is not monolayer limit, but due to micropore filling. Therefore type I physisorption isotherm would be better called pseudo- Langmuir isotherm..")
31
BJH & DH Barrett, Joyner, Halenda and Dollimore-Heal BJH Modified Kelvin equation. Kelvin equation predicts pressure at which adsorptive will spontaneously condense (and evaporate) in a cylindrical pore of a given size. Condensation occurs in pores that already have some multilayers on the wallsequation and the selected statistical thickness (t-curve) equation.. Therefore, the pore size is calculated from the Kelvin DH Extremely similar calculation to BJH, which gives very similar results. Essentially differs only in minor mathematical details.
 in a cylindrical pore of a given size. Condensation occurs in pores that already have some multilayers on the wallsequation and the selected statistical thickness (t-curve) equation.. Therefore, the pore size is calculated from the Kelvin DH Extremely similar calculation to BJH, which gives very similar results. Essentially differs only in minor mathematical details..")
32
HK & SF Horvath-Kawazoe & Saito-Foley HK Direct mathematical relationship between relative pressure (P/Po) and pore size. Relationship calculated from modified Young-Laplace equation, and takes into account parameters such as magnetic susceptibility. Based on slit-shape pore geometry (e.g. activated carbons). Calculation restricted to micropore region ( 2 nm width). SF Similar mathematics to HK method, but based on cylindrical pore geometry (e.g. zeolites). Calculation restricted to micropore region ( 2 nm diameter).
. Calculation restricted to micropore region ( 2 nm width). SF Similar mathematics to HK method, but based on cylindrical pore geometry (e.g. zeolites). Calculation restricted to micropore region ( 2 nm diameter)..")
33
DA & DR Dubinin-Astakov and Dubinin-Radushkevic DA Closely related to DR calculation based on pore filling mechanism. Equation fits calculated data to experimental isotherm by varying two parameters, E and n. E is average adsorption energy that is directly related to average pore diameter, and n is an exponent that controls the width of the resulting pore size distribution. The calculated pore size distribution always has a skewed, monomodal appearance (Weibull distribution). DR Simple log(V) vs log 2 (Po/P) relationship which linearizes the isotherm based on micropore filling principles. “Best fit” is extrapolated to log 2 (Po/P) (i.e. where P/Po = 1) to find micropore volume.
. DR Simple log(V) vs log 2 (Po/P) relationship which linearizes the isotherm based on micropore filling principles. Best fit is extrapolated to log 2 (Po/P) (i.e. where P/Po = 1) to find micropore volume..")
34
Other Methods FRACTAL DIMENSION The geometric topography of the surface structure of many solids can be characterized by the fractal dimension D, which is a kind of roughness exponent. A “flat” surface is considered D is 2, however for an irregular (real) surface D may vary between 2 and 3 and expresses so the degree of roughness of the surface and/or porous structure. The determination of the surface roughness can be investigated by means of the modified Frenkel- Halsey Hill method, which is applied in the range of multilayer adsorption.
 surface D may vary between 2 and 3 and expresses so the degree of roughness of the surface and/or porous structure. The determination of the surface roughness can be investigated by means of the modified Frenkel- Halsey Hill method, which is applied in the range of multilayer adsorption..")
36
Pore Size Distribution Hysteresis is indicative of the presence of mesopores and the pore size distribution can be calculated from the sorption isotherm. Whilst it is possible to do so from the adsorption branch, it is more normal to do so from the desorption branch... Mesopore (Greek meso = middle): 2nm - 50 nm diameter Macropore (Greek macro = large): >50 nm diameter Micropore (Greek micro = small): 0 nm - 2 nm diameter
: 2nm - 50 nm diameter Macropore (Greek macro = large): >50 nm diameter Micropore (Greek micro = small): 0 nm - 2 nm diameter.")
37
Mercury Porosimetry

39
Micro and Mesopore Size Determination by Gas Sorption Quantitative estimation of micropore volume and area… T-plot and DR methods.

40
Multilayer adsorption Type II, IV Relative Pressure (P/Po) Volume adsorbed After the knee, micropores cease to contribute to the adsorption process. Low slope region in middle of isotherm indicates first few multilayers, on external surface including meso and macropores… before the onset of capillary condensation

41
Estimation of Micropores... the t-plot method This method uses a mathematical representation of multi-layer adsorption. The thickness, t, of an adsorbate layer increases with increasing pressure. The t-curve so produced is very similar in appearance to a type II isotherm. For every value of P/Po, the volume adsorbed is plotted against the corresponding value of “t”. If the model describes the experimental data a straight line is produced on the t-plot...

42
The t-plot Resembles a type II Relative Pressure (P/Po) Statistical thickness A statistical monolayer A statistical multilayer
 Statistical thickness A statistical monolayer A statistical multilayer")
43
The utilization of the technique of comparing an isotherm of a microporous material with a standard Type II isotherm is the t-plot method as it was proposed by Lippens and de Boer. This method permits the determination of micropore volume, surface area and it allows in principle also to obtain information about the average pore size. The t-method employs a composite t-standard (reference) curve, obtained from data on a number of nonporous adsorbents with BET C constants similar to that of the microporous sample being tested. Micropore Analysis: The t- Method
 curve, obtained from data on a number of nonporous adsorbents with BET C constants similar to that of the microporous sample being tested. Micropore Analysis: The t- Method.")
44
Statistical Thickness, t Halsey equation Generalized Halsey deBoer equation Carbon Black STSA

45
The t-plot

46
t-plot Method (in the presence of micropores) Intercept = micropore volume
 Intercept = micropore volume")
47
t-plot Method (mesoporous only) Slope = V/t = A Zero intercept
 Slope = V/t = A Zero intercept")
48
t-plot Method showing a “knee” Slope A - slope B = area contribution by micropores size C A C B

49
Estimation of Micropores Dubinin-Radushkevich (DR) Theory W = volume of the liquid adsorbate W 0 = total volume of the micropores B = adsorbent constant = adsorbate constant A linear relationship should be found between log(W) and log 2 (Po/P)...
 Theory W = volume of the liquid adsorbate W 0 = total volume of the micropores B = adsorbent constant = adsorbate constant A linear relationship should be found between log(W) and log 2 (Po/P)...")
50
Log 2 (Po/P) Log (W) Extrapolation yields Wo Estimation of Micropores Dubinin-Radushkevich (DR) Plot 0
 Log (W) Extrapolation yields Wo Estimation of Micropores Dubinin-Radushkevich (DR) Plot 0")
51
Adsorption / Desorption Adsorption = multilayer formation Desorption = meniscus development

52
Kelvin* Equation * Lord Kelvin a.k.a. W.T. Thomson

53
Pore Size r p = actual radius of the pore r k = Kelvin radius of the pore t = thickness of the adsorbed film

54
BJH Method (Barrett-Joyner-Halenda) Pore volume requires assumption of liquid density!
 Pore volume requires assumption of liquid density!")
55
Pore Size Data Volume and size of pores can be expressed from either adsorption and/or desorption data. The total pore volume, V, is taken from the maximum amount of gas adsorbed at the “top” of the isotherm and conversion of gas volume into liquid volume. The mean pore diameter is calculated from simple cylindrical geometry: where A is the BET surface area.

56
Nonlocal Density Functional Theory (NLDFT) or methods of molecular simulation (Grand Canonical Monte Carlo simulation methods (GCMC), Molecular Dynamics methods (MD) Pore size analysis data for micro- and mesoporous molecular sieves (e.g., some zeolites, etc..) obtained with these methods agree very well with the results obtained from independent methods (based on XRD or TEM) Hence, the application of microscopic methods leads to (i) a much more accurate pore size analysis and (ii) allows in principle to perform a pore size analysis over the complete micro/mesopore size range. A drawback of the currently available NLDFT and GCMC methods is certainly, that they do not take sufficiently into account the chemical and geometrical heterogeneity of the pore walls, i.e., usually a structureless (i.e., chemically and geometrically smooth) pore wall model is assumed. However, despite these deficiencies, methods for pore size analysis based on NLDFT and GCMC are meanwhile widely used and are considered as to be the most accurate methods for micro- and mesopore size analysis. APPLICATION OF NLDFT: COMBINED MICRO/ MESOPORE ANALYSIS WITH A SINGLE METHOD
 pore wall model is assumed. However, despite these deficiencies, methods for pore size analysis based on NLDFT and GCMC are meanwhile widely used and are considered as to be the most accurate methods for micro- and mesopore size analysis. APPLICATION OF NLDFT: COMBINED MICRO/ MESOPORE ANALYSIS WITH A SINGLE METHOD.")
57
Amorphous Silica-alumina

58
Example Data: Zeolites

59
Example Data : Microporous Carbon

60
Tag all adsorption points Analyze behavior Note knee – transition from micropore filling to limited multilayering (plateau).
.")
61
Example Data : Microporous Carbon Use Langmuir (Monolayer model) / DR for Surface Area, Micropore Volume Usue Langmuir in range of 0.05 -> 0.2 (monolayer)
 / DR for Surface Area, Micropore Volume Usue Langmuir in range of > 0.2 (monolayer)")
62
Example Data : Microporous Carbon DR Method for surface area, micropore volume Choose low relative pressure points (up to P/P0 = 0.2)
")
63
Example Data : Macroporous Sample Little or no “knee”, isotherm closes at 0.95

64
Example Data : Macroporous Sample BET Plot = OK Surface area ca. 8m 2 /g (low) Note hysteresis above P/P0 = 0.95 Pores > 35 nm
 Note hysteresis above P/P0 = 0.95 Pores > 35 nm.")
65
Example Data : Macroporous Sample Intercept = (-), no micropore volume.
, no micropore volume.")
66
Example Data : Macroporous Sample BJH Shows pores > 20nm, to over 200 nm

67
Example Data : Mesoporous Silica BET Surface area = 112m 2 /g Classic mesoporous silica !

68
Example Data : Mesoporous Silica Statistical Thickness => Use de Boer for oxidic surfaces = silicas Intercept ~ 0 Look at tabular data MP SA = 8m 2 /g (total SA = 112)
")
69
Example Data : Mesoporous Silica Use BJH – shows narrow pore size distribution in 14-17nm range (mesopores)
")
70
Example Data: CuO nanoparticles inside Al-MCM-41 by direct synthesis route Al-MCM-41 (a) Cu-AlMCM-41-Co- synthesized (b) Cu-post-synthesis of Aal- MCM-41 (c)
 Cu-AlMCM-41-Co- synthesized (b) Cu-post-synthesis of Aal- MCM-41 (c)")
71
Pore size analysis of MCM 41 by silica by N 2 sorption at 77 K

72
Example Data: Textural Properties of SBA-15 and Sn-SBA-15 Samples Samples Micropore Mesopore Pore Wall area, m 2 g -1 area, m 2 g -1 width,nm thickness,nm SBA-15 162 725 7.8 4.1 Sn-SBA-15 Si/Sn : 150 68 730 7.1 4.1 80 24 700 7.6 3.2 40 22 661 7.6 3.1 5 21 670 7.6 3.1 Silanol groups on the wall react with Sn precursors closing The micropores. The meso pores remain almost unaffected.

73
Micropore Size Calculation Difficulties are associated with regard to the analysis of micropore adsorption data. Classical, macroscopic, theories [1] like DR and semiempirical treatments such those of HK and SF do not give a realistic description of micropore filling This leads to an underestimation of pore sizes for micropores and even smaller mesopores [2]. [1] F. Rouquerol, J. Rouquerol & K. Sing, Adsorption by Powders & Porous Solids, Academic Press, 1999 [ 2 ] P. I Ravikovitch, G.L. Haller, A.V. Neimark, Advcances in Colloid and Interface Science 76-77, 203 (1998)
.")
74
RECENT ADVANCES IN THE PORE SIZE ANALYSIS OF MICRO- AND MESOPOROUS MOLECULAR SIEVES BY ARGON GAS ADSORPTION

75
Micropore Size Characterization Physical adsorption in micropores, e.g. zeolites occurs at relative pressures substantially lower than in case of adsorption in mesopores. Adsorption measurements using nitrogen at 77.4 K is difficult, because the filling of 0.5 - 1 nm pores occurs at P/Po of 10 -7 to 10 -5, where the rate of diffusion and adsorption equilibration is very slow.

76
Advantages of Using Argon Advantage to analyze such narrow micropores by using argon at liquid argon temperature (87.3 K). Argon fills these micropores (0.5 – 1nm) at much higher relative pressures (i.e., at relative pressures 10 -5 to 10 -3 ) compared to nitrogen.
 at much higher relative pressures (i.e., at relative pressures to ) compared to nitrogen..")
77
Advantages of Higher Temperature & Pressure Accelerated diffusion. Accelerated equilibration processes. Reduction in analysis time.

78
Argon Adsorption at 87.3 K versus Nitrogen Adsorption at 77.4 K The different pore filling ranges for argon adsorption at 87.3K and nitrogen adsorption at 77.4K in faujasite-type zeolite are illustrated above.

79
New Calculation To overcome the above mentioned problems we introduce a new method for micropore analysis based on a Non-local Density Functional Theory (NLDFT) model by Neimark and Co-workers [3-5]. The new DFT-method is designed for micro- mesopore size characterization of zeolitic materials ranging in size from 0.44 to 20 nm using high-resolution low-pressure argon adsorption isotherms at 87.3 K. [3] P.I. Ravikovitch, G.L. Haller, A.V. Neimark, Advances in Colloid and Interface Science, 76 – 77 (1998), 203 -207 [4] A.V. Neimark, P.I Ravikovitch, M. Gruen, F. Schueth, and K.K. Unger, J. Coll. Interface Sci., 207, (1998) 159 [5] A.V. Neimark, P.I. Ravikovitch, Microporous and Mesoporous Materials (2001) 44-45, 697
![New Calculation To overcome the above mentioned problems we introduce a new method for micropore analysis based on a Non-local Density Functional Theory (NLDFT) model by Neimark and Co-workers [3-5].](http://images.slideplayer.com/29/9442066/slides/slide_79.jpg "The new DFT-method is designed for micro- mesopore size characterization of zeolitic materials ranging in size from 0.44 to 20 nm using high-resolution low-pressure argon adsorption isotherms at 87.3 K. [3] P.I. Ravikovitch, G.L. Haller, A.V. Neimark, Advances in Colloid and Interface Science, 76 – 77 (1998), [4] A.V. Neimark, P.I Ravikovitch, M. Gruen, F. Schueth, and K.K. Unger, J. Coll. Interface Sci., 207, (1998) 159 [5] A.V. Neimark, P.I. Ravikovitch, Microporous and Mesoporous Materials (2001) 44-45, 697.")
80
Systematic, Experimental Study To evaluate the application of argon sorption for micro- and mesopore size analysis of zeolites and mesoporous silica materials including novel mesoporous molecular sieves of type MCM-41 and MCM-48. The sorption isotherms were determined using a static volumetric technique Samples were outgassed for 12 h under vacuum (turbomolecular pump) at elevated temperatures (573 K for the zeolites and 393 K for MCM- 41/MCM-48).
 at elevated temperatures (573 K for the zeolites and 393 K for MCM- 41/MCM-48)..")
81
Results Argon adsorption isotherms at 87 K on MCM-41, ZSM-5 and their 50-50 mixture.

82
Results

83
Adsorption isotherms with Argon at 87.5 K Zeolites and Mesoporous Materials

84
Low pressure regions of adsorption isotherms of zeolites And mesoporous materials using Ar at 87.5 K

85
ZSM-5

86
MCM 41

87
Evaluation of DFT Algorithm

88
Pore Size Distribution

89
Isotherms of Different adsorbents on ZSM-5 And Silicalite -1

90
Discussion Argon sorption at 77 K is limited to pore diameters smaller than 12 nm. i.e. no pore filling/pore condensation can be observed at this temperature for silica materials containing larger pores. This lack of argon condensation for pores larger than ca. 12 nm is associated with the fact, that 77 K is ca. 6.8 K below the bulk triple point [4,5]. [4] M. Thommes, R. Koehn and M. Froeba, J. Phys. Chem. B (2000), 104, 7932 [5] M. Thommes, R. Koehn and M. Froeba, Stud. Surf. Sci. Catal., (2001), 135 17
, 104, 7932 [5] M. Thommes, R. Koehn and M. Froeba, Stud. Surf. Sci. Catal., (2001),")
91
Discussion These limitation do not exist for argon sorption at its’ boiling temperature, i.e. ca. 87 K. Pore filling and pore condensation can be observed over the complete micro- and mesopore size range.

92
Discussion Results of classical, and semi-empirical methods (e.g., BJH, SF etc) indicate that these methods underestimate the pore size considerably. Deviations from the DFT-results are often in a range of ca. 20 % for pore diameters < 10 nm.

93
Rapid Micropore Size Analysis by CO 2 Adsorption Speed of analysis; with the higher diffusion rate at 273.15K, analysis times are reduced as much as 90%. Carbon dioxide at 273.15K permits probing pores from about 2 angstroms (0.2 nm). DFT has recently been applied to describe the behavior of fluids that are confined in small pores. The current popular gas sorption models, e.g. BJH, HK, SF, DA, etc., assume that the density of the adsorbed phase remains constant, regardless of the size of the pores that are being filled. Packing considerations suggest that these models are less than satisfactory for analyses of pores less than 2 nm. For a given adsorbate-adsorbent system, DFT calculates the most likely summation of "ideal isotherms“ calculated from "ideal pores" of fixed sizes needed to match the experimental results.
. DFT has recently been applied to describe the behavior of fluids that are confined in small pores. The current popular gas sorption models, e.g. BJH, HK, SF, DA, etc., assume that the density of the adsorbed phase remains constant, regardless of the size of the pores that are being filled. Packing considerations suggest that these models are less than satisfactory for analyses of pores less than 2 nm. For a given adsorbate-adsorbent system, DFT calculates the most likely summation of ideal isotherms calculated from ideal pores of fixed sizes needed to match the experimental results..")
94
CO 2 for Speed! Typically, micropore analyses with nitrogen as adsorbate will require 24 hours or more to run. Using carbon dioxide as adsorbate provides several advantages. –Carbon dioxide molecules are slightly thinner than nitrogen molecules (2.8 angstroms radius vs. 3.0 angstroms) and will fill smaller pores than nitrogen. –The use of carbon dioxide allows the measurements to be made at 273.15K, typically with an ice/water bath. –There is no longer any need to provide and maintain or replenish a level of liquid nitrogen during the analysis.
 and will fill smaller pores than nitrogen. –The use of carbon dioxide allows the measurements to be made at K, typically with an ice/water bath. –There is no longer any need to provide and maintain or replenish a level of liquid nitrogen during the analysis..")
95
CO2 Benefits This higher diffusion rate is responsible for reducing the analysis time to a few hours for a complete adsorption experiment. The faster rate also provides for the possibility of using larger samples than with nitrogen adsorption, thus reducing sample weighing errors. Pore size distributions thus obtained are comparable to those from a 24-hour nitrogen/77.35 K analysis.

96
N2 Adsorption @ 77K: 40 hours

97
CO2 adsorption at 273K: 2.75 hours

98
CO 2 Adsorption at 0 o C Density Functional Theory Micropore Distribution

99
CO 2 Adsorption at 0 o C Monte Carlo Simulation Micropore Distribution

100
Tensile strength effect in Microporous Materials J.C. Groen et al. / Microporous and Mesoporous Materials 60 (2003) 1–17
 1–17.")
101
Fluid-to-crystalline phase transitions in MFI zeolites This step-wise behavior can be explained by a fluid-to-crystalline like phase transition of the adsorbed phase in the micropores, and does not indicate any real porosity

102
Conventional models (BJH, HK, SF) are very useful to analyze adsorption data, but only apply to a given part of the isotherm. Consequently, these models can only partially deal with adsorption in the more sophisticated materials and should not be used following a ‘‘press button’’ approach in commercial software. A solid background for correct interpretation is obviously required. Development of (NL)DFT models, accompanied by molecular simulations and molecular dynamics, has led to a better understanding of adsorption processes in well ordered systems compared to the more conventional models. CONCLUDING REMARKS
DFT models, accompanied by molecular simulations and molecular dynamics, has led to a better understanding of adsorption processes in well ordered systems compared to the more conventional models. CONCLUDING REMARKS.")
103
However, the perception that the models developed so far can adequately cover the whole p-po range of the isotherm for pore size calculations, thus avoiding the use of separate models to calculate micro- and mesopore size distributions, has shown limited practical application. Major limitations of these models are the non-allowance for network effects and a poor description of the geometrical and energetic effects of the pore and pore wall. The development of both robust models and well- defined reference materials would surely improve the accuracy and reliability of calculated PSDs for micro- and mesoporous materials. CONCLUDING REMARKS J.C. Groen et al. / Microporous and Mesoporous Materials 60 (2003) 1–17
 1–17.")
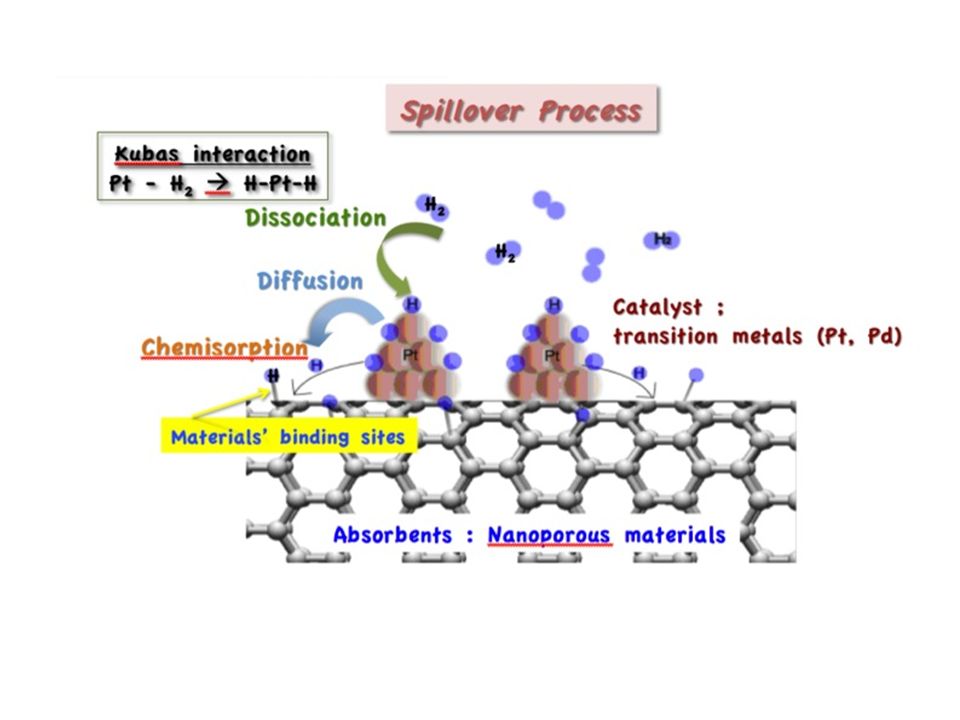
104
Chemisorption: Active Sites Characterization of surfaces: Specific surface area of phases Types of active sites Number of active sites Reactivity of active sites Stability of active sites Adsorption process Heterogeneous catalysis Reduction of ores Chemical Vapour Deposition Coal gasification and combustion Corrosion Chemisorption important for: A chemical reaction takes place: chemical bonds are formed Driving force: minimisation of Gibbs Free Energy (50 - 400 kJ/mol)
")
105
Chemisorption - Experimental Techniques Gravimetry Volumetry Spectroscopy (Infrared, Raman) Pulse techniques Temperature Programmed Desorption (TPD) Gravimetry
 Pulse techniques Temperature Programmed Desorption (TPD) Gravimetry")
106
Metal Dispersion D Dispersion: Chemisorption: titration of surface sites n s = number of surface atoms n T = total number of atoms p n ads number of moles in monolayer Stoichiometry ?? nsns

107
Various Modes of Adsorption O CC O C O C O C O C O a. b. c. d. e. a. linear or terminal (X = 1) b. bridged (X = 0.5) c. bridged (X = 0.67) d. valley or triple (X = 0.33) e. dissociative adsorption (X = 0.5) X = average number of adsorbed molecules per active site
 b. bridged (X = 0.5) c. bridged (X = 0.67) d. valley or triple (X = 0.33) e. dissociative adsorption (X = 0.5) X = average number of adsorbed molecules per active site.")
108
Crystallographic Planes 8 79 Coordination number:

109
Adsorption Stoichiometry

110
Volume-Surface Mean Diameter d VS Dmost fundamental parameter d VS most convenient for measuring directly (XRD, EM) d VS (nm) D Ni Pt 15 10 5 0 0.0 0.5 1.0
 d VS (nm) D Ni Pt")
111
Dispersion D versus Diameter d Diameter d can be measured or calculated from several techniques – Electron Microscopy – X-ray Diffraction, X-ray Photoelectron Spectroscopy Relation D and d (for spheres) ??
")
112
Number of Surface Atoms per Unit Area Dependent on particle size

113
Shapes of Catalyst Particles on a Support a. c. b. d. poisoned part of surface Spherical Crystallite Hemispherical Complete wetting

114
Chemisorption - Experimental Techniques Gravimetry Volumetry Spectroscopy (Infrared, Raman) Pulse techniques Temperature Programmed Desorption (TPD) Gravimetry
 Pulse techniques Temperature Programmed Desorption (TPD) Gravimetry")
115
Chemisorption of N 2 O on Cu Catalyst 2 Cu (s) + N 2 OCu 2 O (s) + N 2 0 50 100 150 200 250 300 1.6 1.4 1.2 1.0 0.8 0.6 0.4 0.2 0.0 Time (min) W (mg O/g Cu)
 + N 2 OCu 2 O (s) + N Time (min) W (mg O/g Cu)")
116
H 2 Chemisorption on Ni/Al 2 O 3 (323 K) Irreversible Reversible after high-T evacuation after subsequent low-T evacuation
 Irreversible Reversible after high-T evacuation after subsequent low-T evacuation")
117
Results of Barometric H 2 Chemisorption

118
Chemisorption Techniques Most techniques are rather “blind” but quantitative Transient techniques also give kinetic information – pulse response, step response – TPD (NH 3 also acid strength) “In-situ” techniques also give qualitative information: – in-situ infrared spectroscopy – simultaneous measurement of heat effects
 In-situ techniques also give qualitative information: – in-situ infrared spectroscopy – simultaneous measurement of heat effects")
119
Pulse-Response Method 0.0 1.0 01 Time of analysis Detector signal CO chemisorption on reduced 5wt% Pt/Al 2 O 3 TCD signals after CO pulses

120
Pulse-Response Method 0.00 0.02 0.04 0.06 0.08 00.511.5 Pulsed volume (ml) n ad (mmol/g) S Pt = 3 m 2 /g D Pt = 24 % S Pt = 3 m 2 /g D Pt = 24 % CO chemisorption on reduced 5wt% Pt/Al 2 O 3 Cumulative amount of chemisorbed CO Monolayer capacity: 0.06 mmol / g Pt
 n ad (mmol/g) S Pt = 3 m 2 /g D Pt = 24 % S Pt = 3 m 2 /g D Pt = 24 % CO chemisorption on reduced 5wt% Pt/Al 2 O 3 Cumulative amount of chemisorbed CO Monolayer capacity: 0.06 mmol / g Pt")
121
Step-Response Method Example: 2 Cu (s) + N 2 OCu 2 O (s) + N 2 Catalyst Mass Spectrometer t N2ON2O N2ON2O N2N2 StepResponse
 + N 2 OCu 2 O (s) + N 2 Catalyst Mass Spectrometer t N2ON2O N2ON2O N2N2 StepResponse")
122
Step-Response Method Quantification of metallic Cu surface area of reduced Cu-ZnO/Al 2 O 3 catalyst by N 2 O chemisorption: 2 Cu (s) + N 2 OCu 2 O (s) + N 2 Dead time 0 300 600 900 6 4 2 0 Flow switch in Time (s) Flow switch out N 2 N 2 O Concentration of gas-phase species (% atm.) t 0
 + N 2 OCu 2 O (s) + N 2 Dead time Flow switch in Time (s) Flow switch out N 2 N 2 O Concentration of gas-phase species (% atm.) t 0")
124
Turn over rate or turn over frequency The rate should, if possible, be referred to the number of active sites, because such a value expresses the rate at which the catalytic cycle turns over. TOF is a differential quantity and depends on T, P and Concentrations. It is hard to measure. Why? 1. Determine the rate. The rates may be under the influence of heat and mass transfer, masked by poisoning, activation, deactivation, and other phenomena. 2.Identify the catalytically active site and then count them Are they identical or not? In many cases, they are not. Whether they interact among themselves? Counting should be done ‘in situ’ under reaction conditions. Still, TOFs have been determined convincingly

125
TOF: Examples to illustrate its usefulness in heterogeneous catalysis 1.Zeolites: Protonic sites have been identified and it is shown that there is no interactions between them. n-Hexane cracking: the rate Al content Clearly, all catalytic sites are identical and non-interacting. Linear correlation between activity and concentration of Brönsted acid sites. Werner Haag: “The possibility to synthesize zeolite catalysts with a well-defined pre-determined number of active sites of uniform activity is certainly without parallel in heterogeneous catalysis” Turnover frequencies for a variety of acid catalyzed hydrocarbon reactions could be determined for the first time

126
EXAMPLES TO ILLUSTRATE THE USEFULNESS OF TOF 2. Metals: Whether the reaction is structure sensitive or insensitive Operational definition of structure sensitivity is that the rate of the reaction or its TOF depends on surface crystalline anisotropy revealed by working on different faces of a single crystal or on clusters of varying size between 1 and 10 nm a) Lack of particle size effect was first noted for the hydrogenation of cyclopropane on supported Pt. b) The effect of particle size was first observed for the synthesis of NH3
 Lack of particle size effect was first noted for the hydrogenation of cyclopropane on supported Pt. b) The effect of particle size was first observed for the synthesis of NH3.")
127
Structure insensitive Reactions The rate or TOF under fixed conditions does not depend or depends only slightly on surface crystalline anisotropy - Metal clusters of varying size or - Single crystals exposing different phases TOF of similar value is seen for different supports, different faces and on single crystals of the same metal How is it possible to avoid significant effects of surface crystalline anisotropy on reaction rates?

128
1. The rate-determining step should consist of only one or at best two adjacent metallic atoms. 2. Surface coverage during reaction should be close to saturation and surface anisotropy is erased by surface reconstruction. Surface reconstruction during adsorption or catalysis (to minimize surface free energy) was proposed by Boreskov as a general principle in heterogeneous catalysis. If this is thermodynamically favoured, whether it can be reached kinetically in a catalytic run? 3. Formation of a reactive hydrocarbon over-layer on a metal surface during a reaction involving hydrocarbons. If the rate-determining step is the dissociation of H 2 on this over layer, insensitivity to the metal structure is understandable Structure insensitive Reactions TOF is meaningful for such a structure insensitive reaction, as all accessible surface atoms can be considered as equally active sites.
 was proposed by Boreskov as a general principle in heterogeneous catalysis. If this is thermodynamically favoured, whether it can be reached kinetically in a catalytic run. 3. Formation of a reactive hydrocarbon over-layer on a metal surface during a reaction involving hydrocarbons. If the rate-determining step is the dissociation of H 2 on this over layer, insensitivity to the metal structure is understandable Structure insensitive Reactions TOF is meaningful for such a structure insensitive reaction, as all accessible surface atoms can be considered as equally active sites..")
129
Comparison of Rate Data Hydrogenation of cyclohexene with H 2 (1 atm) at 298 K Supported MetalMetal exposed a TOF (s -1 ) % Gas phaseLiquid phase Ni36 – 100 2.0 ± 0.50.45 ± 0.15 Rh 5 – 100 6.1 ± 1.01.3 ± 0.1 Pd11 – 76 3.2 ± 0.81.5 ± 0.2 Pt14 – 100 2.8 ± 0.10.6 ± 0.1 a Determined by H 2 chemisorption 1.TOF values for Ni, Rh, Pd and Pt differ by less than an order of magnitude 2.For a given metal, TOF in the liquid phase is lower than that in the gas phase by less than an order of magnitude.
 at 298 K Supported MetalMetal exposed a TOF (s -1 ) % Gas phaseLiquid phase Ni36 – ± ± 0.15 Rh 5 – ± ± 0.1 Pd11 – ± ± 0.2 Pt14 – ± ± 0.1 a Determined by H 2 chemisorption 1.TOF values for Ni, Rh, Pd and Pt differ by less than an order of magnitude 2.For a given metal, TOF in the liquid phase is lower than that in the gas phase by less than an order of magnitude.")
130
Structure-sensitive reactions NH 3 synthesis on Fe Catalytic reaction on single crystal of Fe at high pressures (Somorjai et al) shows the most active face of iron to be (111) plane, by more than two orders of magnitude for the rate. This was attributed to special sites with a coordination number seven. The TOF on Fe(111) extrapolated to TOF data on ammonia synthesis at 1 bar on a multiply promoted industrial catalyst, the surface of which is probably reconstructed during the reaction so as to expose the most active sites. The two TOF values agree within a factor of two. It is the first time that a true TOF has been reported for a structure-sensitive reaction on a complex commercial metallic catalyst.
 extrapolated to TOF data on ammonia synthesis at 1 bar on a multiply promoted industrial catalyst, the surface of which is probably reconstructed during the reaction so as to expose the most active sites. The two TOF values agree within a factor of two. It is the first time that a true TOF has been reported for a structure-sensitive reaction on a complex commercial metallic catalyst..")
131
Turn-over rates on Rh catalysts for reactions, as a function of particle size: a)CO + ½ O 2 →CO 2 Structure insensitive (430 K) b)CO + NO → CO 2 + ½ N 2 Structure Sensitive (505 K) STRUCTURE SENSITIVE AND INSENSITIVE REACTIONS
CO + ½ O 2 →CO 2 Structure insensitive (430 K) b)CO + NO → CO 2 + ½ N 2 Structure Sensitive (505 K) STRUCTURE SENSITIVE AND INSENSITIVE REACTIONS")
132
Turn-over and NO reaction TOF values per one Cu ion decreased significantly with increasing Cu loading in decane-SCR-NO. They increase with the increasing Cu loading in NO decompositon. A single exponential dependence of TOF values with Cu loadings suggests the presence of Two different Cu centres. Ref: J. Dedecek et al., Appl.Catal. A:General, 307 (2006)156 Dependence of TOF on Cu loading in decane- SCR-NO in presence of H 2 O at 250 o C and in Decomposition of NO at 400 o C over Cu-ZSM-5
156 Dependence of TOF on Cu loading in decane- SCR-NO in presence of H 2 O at 250 o C and in Decomposition of NO at 400 o C over Cu-ZSM-5.")
133
What information TOF can give 1.Heat and Mass transfer: ( a major obstacle in correct measurement of intrinsic kinetic data in heterogeneous catalysis) If the TOF is similar for two catalysts with different amounts of a metal on a porous support, then the kinetic data are not disguised by heat and mass transfer 2. Occurrence of poisoning: E.g., Hydrogenation of cyclohexene on Pt/Alumina catalyst was found to be poisoned by sulfur from the support 3. Surface diffusion of an adsorbate on the support to the interface: E.g.,CO oxidation with O 2 on Pd supported on Al 2 O 3 → anomalous TOF value! 4. Role of promoters: E.g., NH 3 synthesis on metallic Fe, the role of alumina is only textural; By contrast, K oxide promoters do change TOF per iron atom exposed. 5. New catalytic materials: Comparison should be through TOF The method of counting sites should be fully described (Important for new materials)
.")
134
Why TOF values are not reported more often? 1.The reaction rate, differential quantity, that is always hard to measure 2.Heterogeneous catalysts: the rates are even harder to measure due to problems of heat and mass transfer; catalyst deactivation 3.Estimation of number of sites is difficult, they may not be equally active The turnover will have an average All that is measured is Yield Alternatively, report STY : Site time yield Number of molecules of a specified product made per catalytic site for unit time If the estimation of number of active sites is difficult, the least one should do is, report Space time yield, which is the Number of molecules of a specified product made per unit volume of reactor per unit time. The Space time yield for large catalytic processes is of the order of 1 mol cm -3 s -1 which translates roughly into STY equal to 1 s -1 also in order of magnitude.

135
Strength of adsorption is only one of the parameters affecting the catalytic activity. The number of chemisorbed molecules is also important. It follows that the more chemisorbed species means more reaction product molecules. The number of molecules forming chemisorption bonds with the catalyst surface is related to the number of surface atoms available for bonding. Maximising the number of surface sites for chemisorption is a top priority in good supported metal catalyst design. The volcano relationship in heterogeneous catalysis

136
Experimental HDS activity of X/MoS 2 catalysts Vs. adsorption energy of thiophene on replaced XMo 15 S 32 clusters The volcano Relationship in Catalysis Formic acid decomposition on various metals and their heats for formation of formate salts

137
Electronic factors in catalysis: The volcano curve Density Functional Theory is used to calculate how the electronic property of metals affect the energies of intermediates and transition states. NH 3 Synthesis: A linear relationship exists between the activation energy for N 2 dissociation and the binding energy of adsorbed nitrogen. The NH 3 synthesis activity under industrial conditions can be deter- mined as a function of the nitrogen- surface interaction energy by combining the calculated adsorption energy-activation energy relation with a micro-kinetic model. The result is a volcano curve and such relationships exist for both promoted and alkali-promoted metal catalysts Calculated NH 3 synthesis TOF for a non- promoted active site as a function of the potential energy of adsorbed atomic nitrogen. Conditions:1 bar; H 2 /N 2 =3:1; 400 o C; 0.2% NH 3

138
OUR EFFORTS “……..Catalysis is one in which technology has generally been ahead of the science. However, efforts to understand the scientific issues underlying a catalytic process have frequently led to significant improvements in the process, and sometimes basic scientific efforts have led to a new catalyst system which improved processes dramatically.” - John Sinfelt, 1999

Similar presentations


>")


 Dr/Marwa Abdelfattah Fall 2013-2014.>")