Download presentation
Presentation is loading. Please wait.

1
Surrogate Endpoints for Hepatitis B Trials Greg Soon, Ph.D Rafia Bhore, Ph.D. Division of Biometrics III/Antiviral 8/7/2002 AC

2
Potential Surrogate Endpoints Knodell Score (Biopsy, Histology) ALT, HBV DNA –Proportion < threshold –Change from Baseline –End of treatment –Time to suppression –Duration of suppression –Time to virologic failure –DAVG or Average change over time –Others HBeAg, HBeAb, HBsAg, HBsAb Composition of the above
 ALT, HBV DNA –Proportion < threshold –Change from Baseline –End of treatment –Time to suppression –Duration of suppression –Time to virologic failure –DAVG or Average change over time –Others HBeAg, HBeAb, HBsAg, HBsAb Composition of the above")
3
Data Source: EpivirHBV Submission

4
Data Source: Adefovir Submission

5
HBV DNA Assays Lamivudine trials used Abbott Hybridization assay, which has a lower limit of approximately 500,000 copies/mL –Limiting ability to differentiate patient responses on viral load –Converted to copies/mL for this presentation Adefovir Trials used PCR assay that has a lower limit of 400 copies/mL

6
Overview Summary of Efficacy Patient-level Correlation Trial-level Correlation Proportion of Treatment Effect Explained (PTE) Summary
 Summary")
7
Overview Summary of Efficacy Patient-level Correlation Trial-level Correlation Proportion of Treatment Effect Explained (PTE) Summary
 Summary")
8
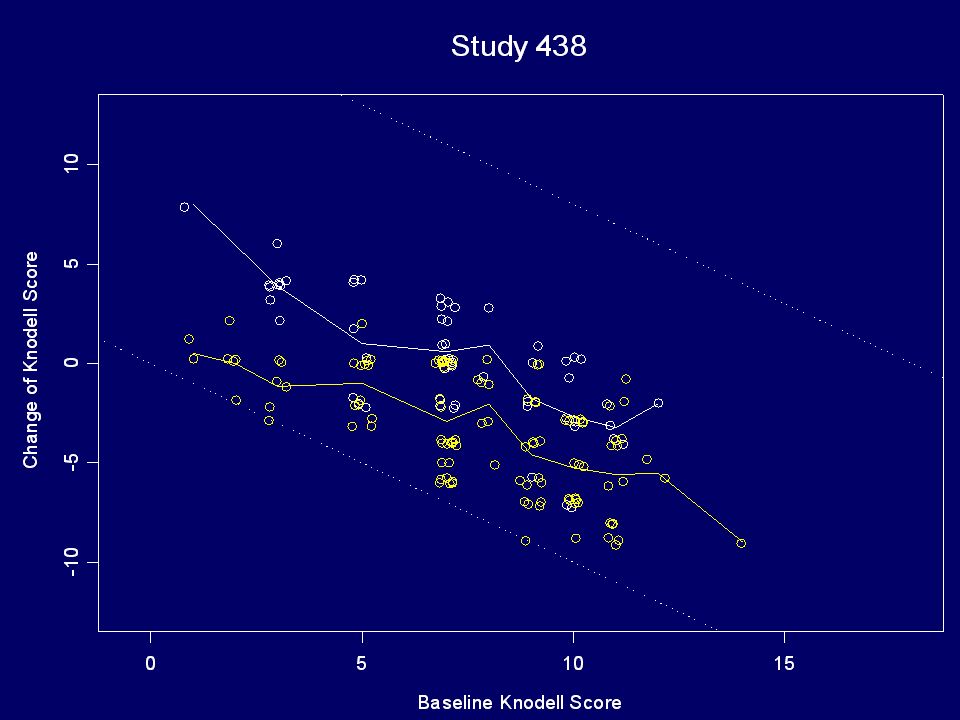
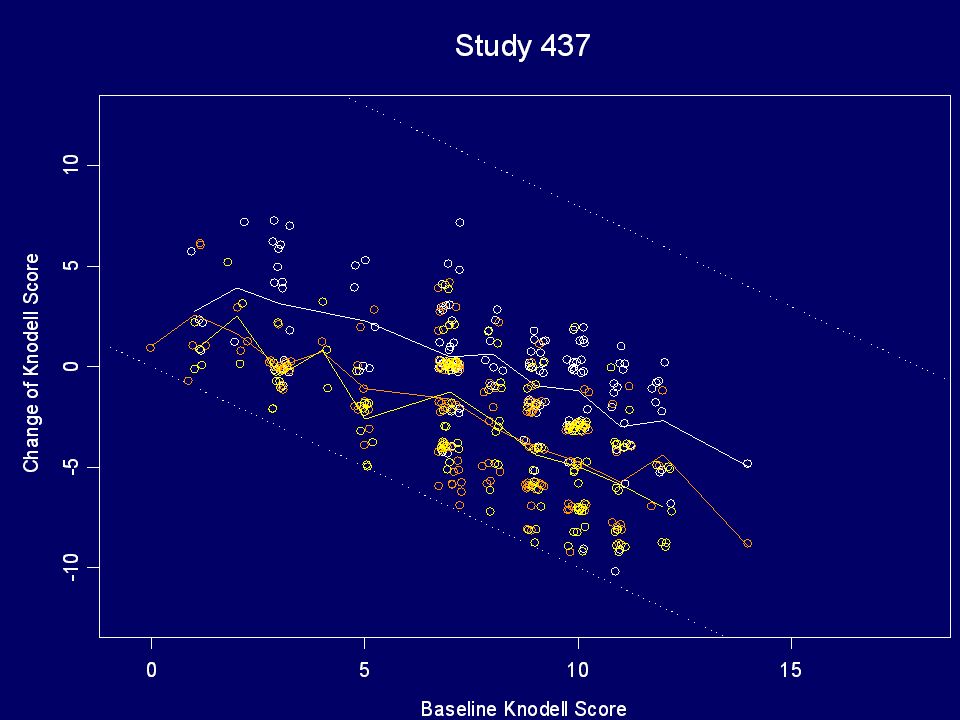
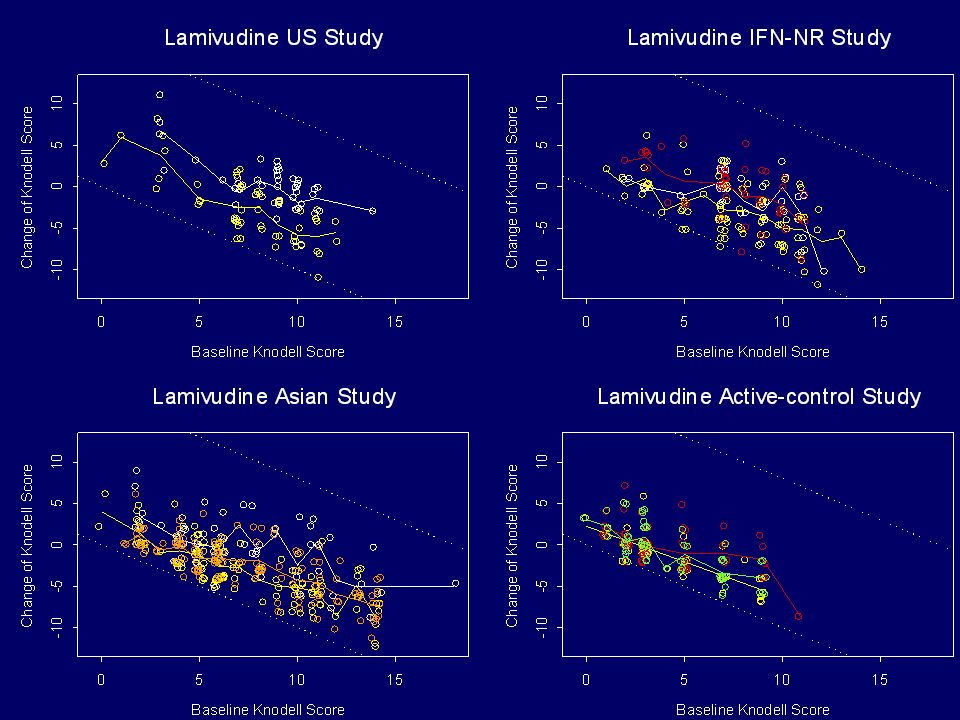
Change of Knodell Score vs Baseline

9
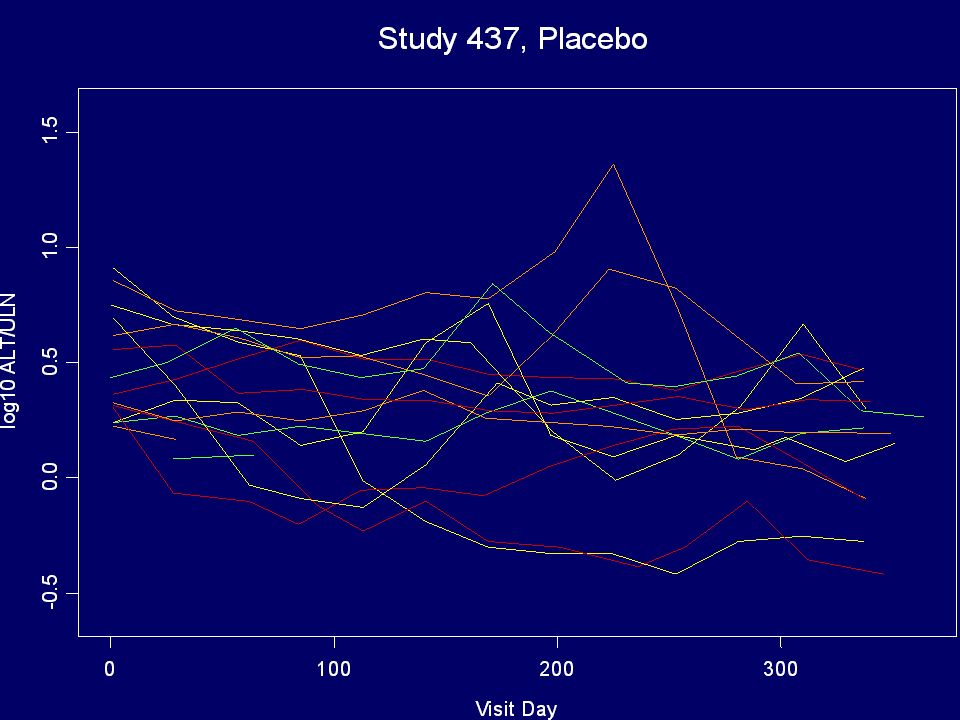
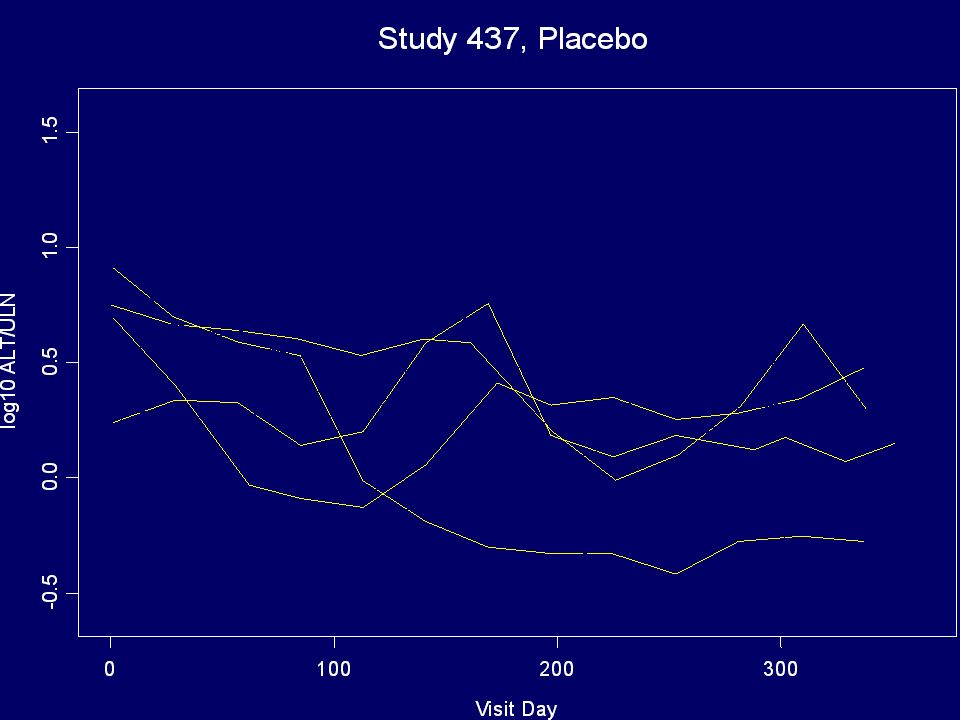
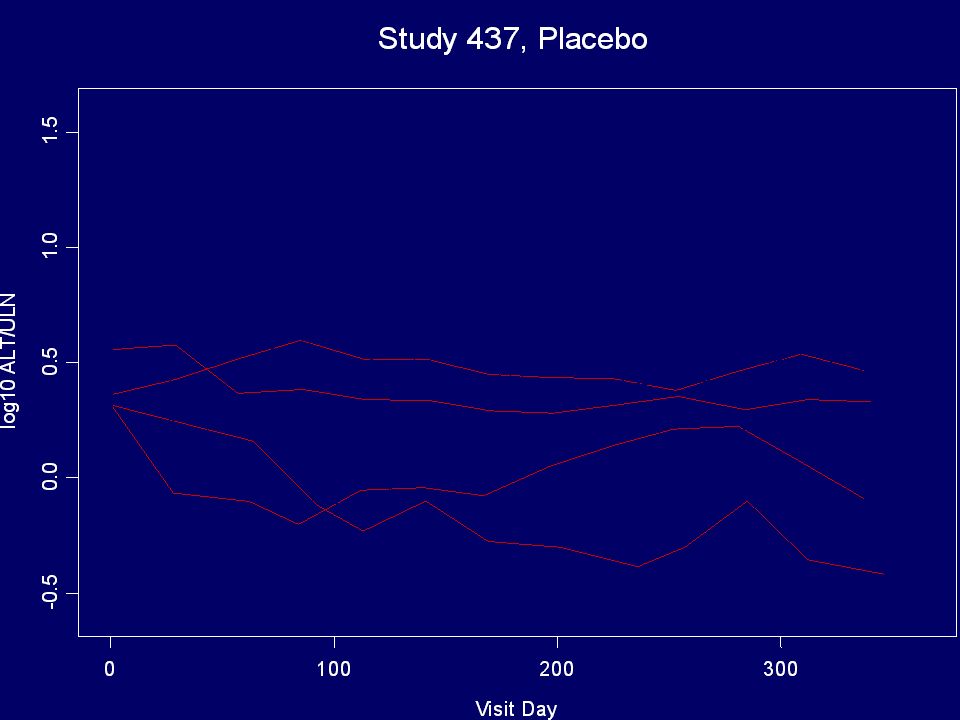
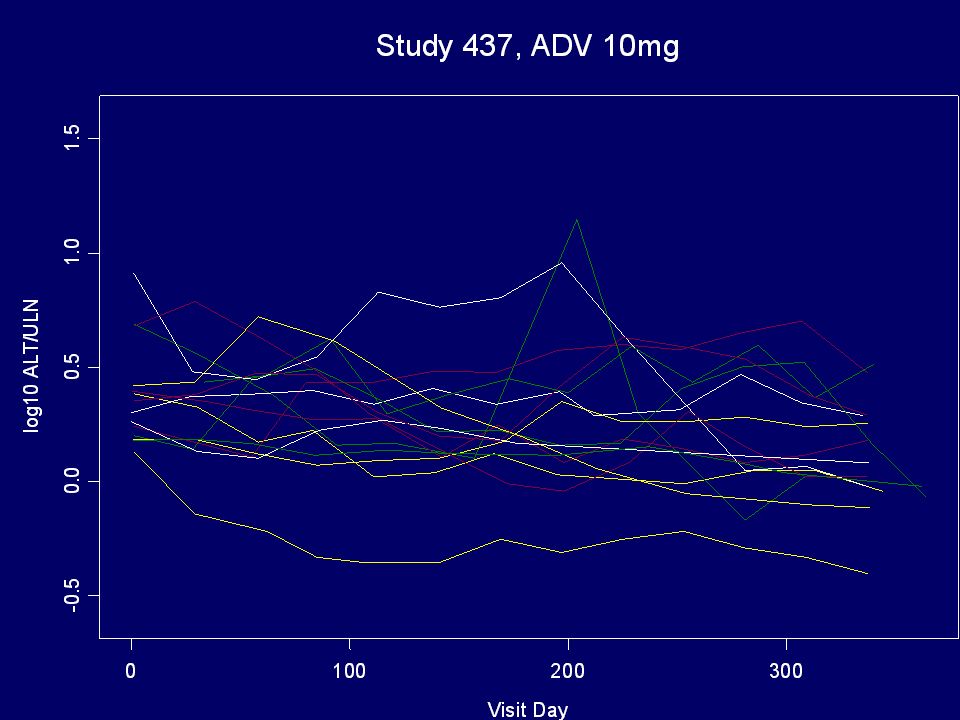
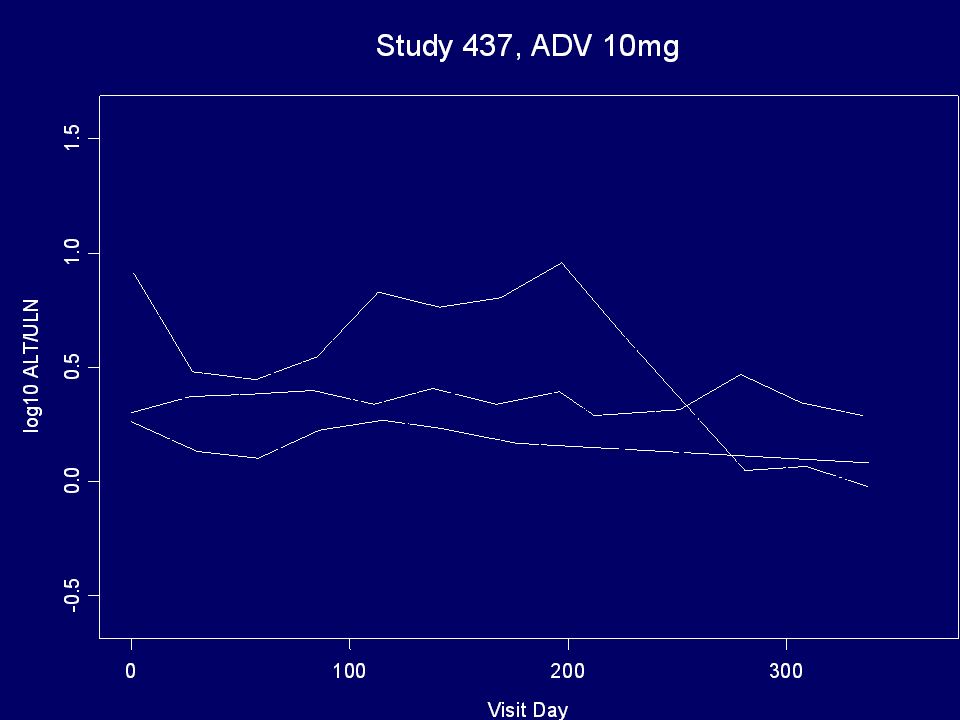
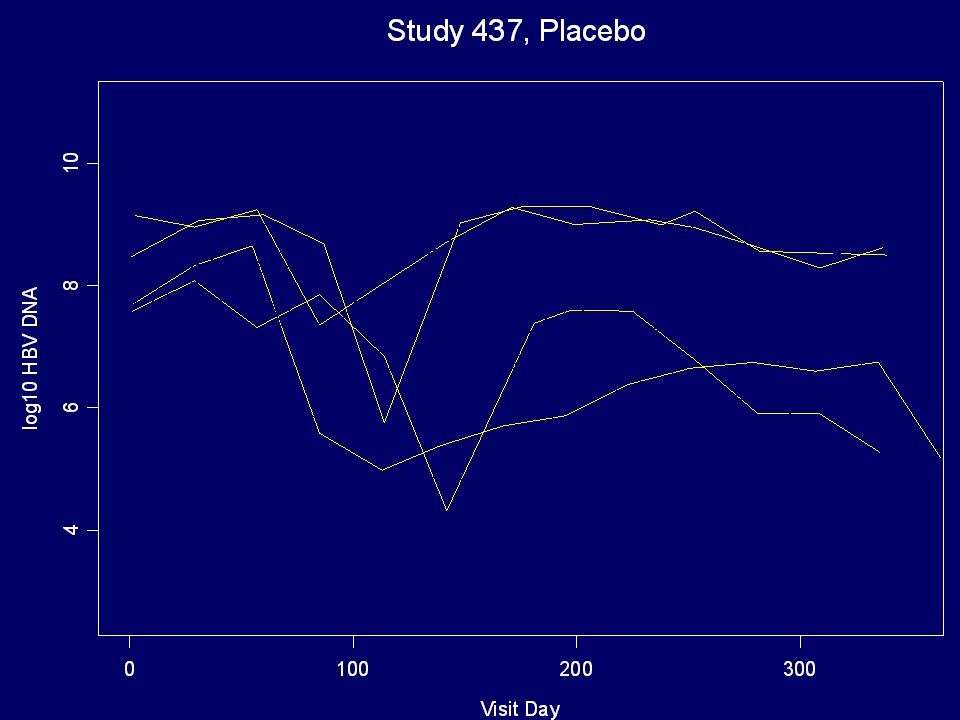
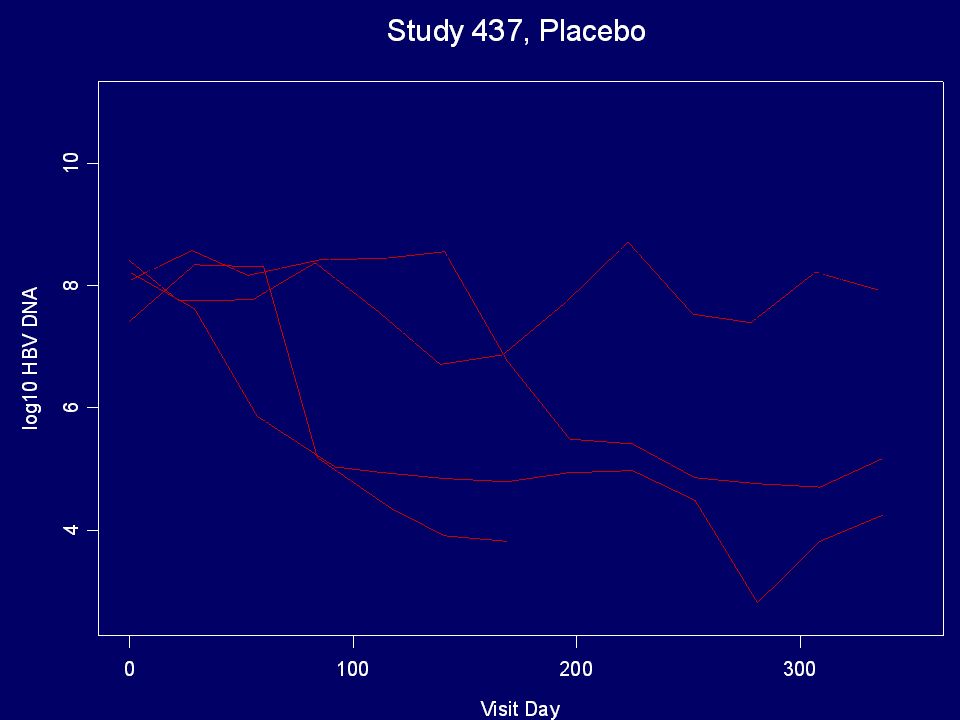
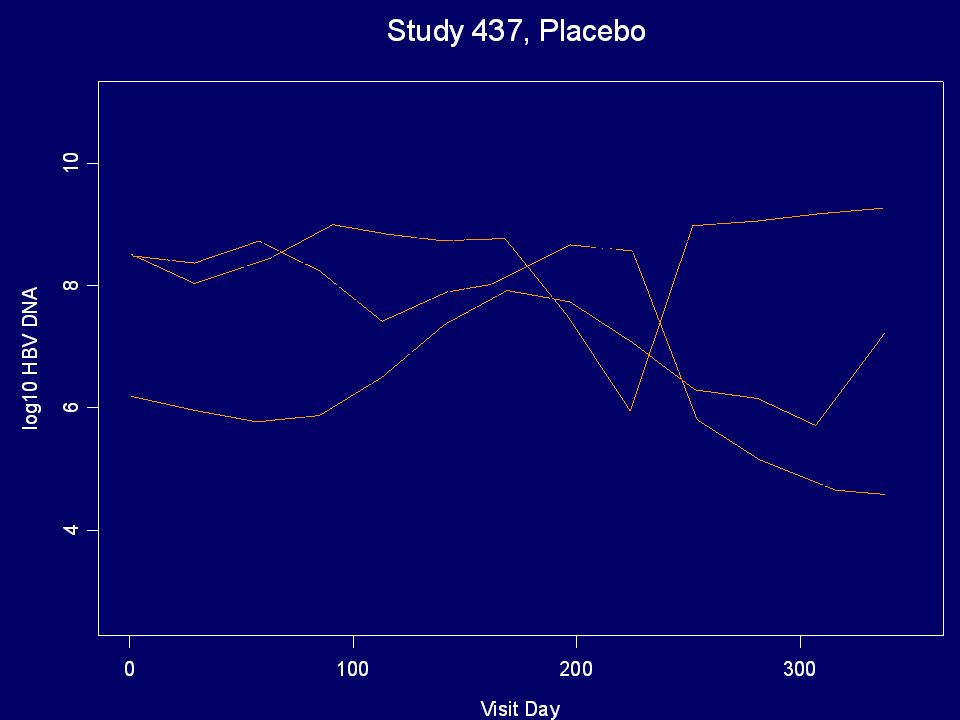
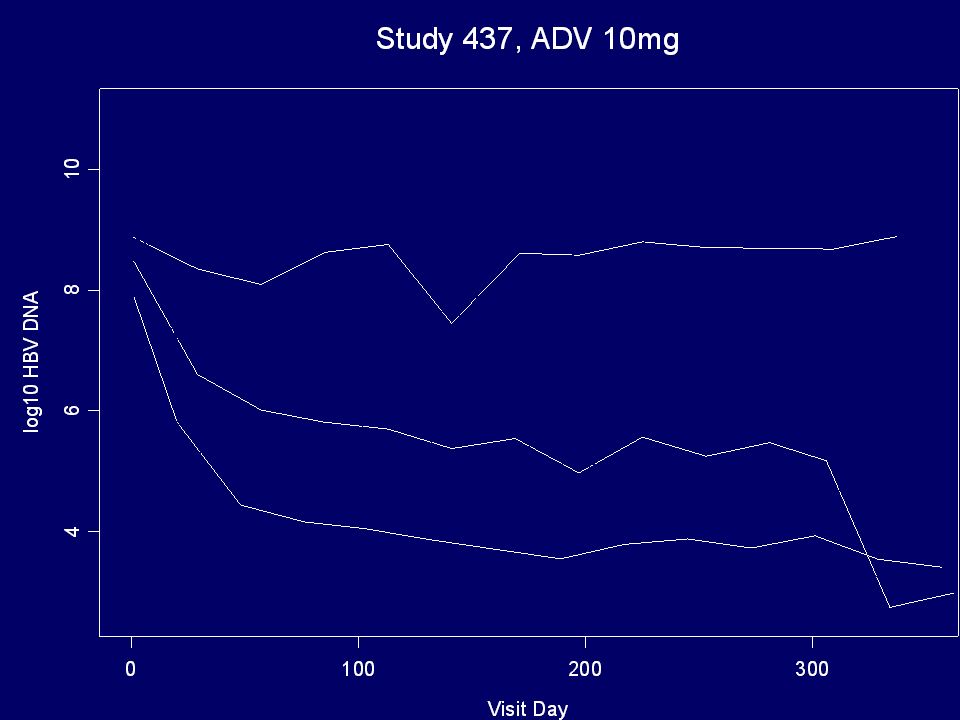
Convention White for placebo arms Yellow for LAM 100mg or ADV 10mg Orange for LAM 25mg or ADV 30mg Red for IFN + LAM 100mg Green for IFN alone

13
Log10 ALT/ULN Over Time

14
Study 438

15
Study 437

16
LAM Studies

17
Study 437

25
Log10 HBV DNA Over Time

26
Study 438

27
Study 437

28
LAM Studies

29
Study 437

37
HBeAg Loss Over Time

38
Study 437

39
LAM Studies

40
Transition of HBeAg Status

41
Overview Summary of Efficacy Patient-level Correlation Trial-level Correlation Proportion of Treatment Effect Explained (PTE) Summary
 Summary")
42
Lamivudine: HBV DNA vs. Knodell Change of Knodell Score Year 1 LOG10 HBV DNA

43
Change of Knodell Score Year 1 LOG10 HBV DNA Lamivudine: HBV DNA vs. Knodell

44
Lamivudine: Correlation Year 1 HBV DNA vs. Knodell Score Change *: p-value<0.05**: p-value<0.001

45
Change of Knodell Score Year 1 LOG10 HBV DNA Adefovir: HBV DNA vs. Knodell

46
Adefovir: Correlation Year 1 HBV DNA vs. Knodell Score Change *: p-value<0.05**: p-value<0.001

47
Lamivudine: ALT vs. Knodell Change of Knodell Score Change of LOG10 ALT

48
Change of Knodell Score Change of LOG10 ALT Lamivudine: ALT vs. Knodell

49
Lamivudine: Correlation ALT Change vs. Knodell Score Change *: p-value<0.05**: p-value<0.001

50
Change of Knodell Score Change of LOG10 ALT Adefovir: ALT vs. Knodell

51
Adefovir: Correlation ALT Change vs. Knodell Score Change *: p-value<0.05**: p-value<0.001

52
DNA, HBeAg & Knodell 438 437 Yr 1 eAg Neg 437 Yr 1 eAg + 38 68 62 13 6 17 34 13 21 41 10 16 215 10 53

53
Joint Prediction

54
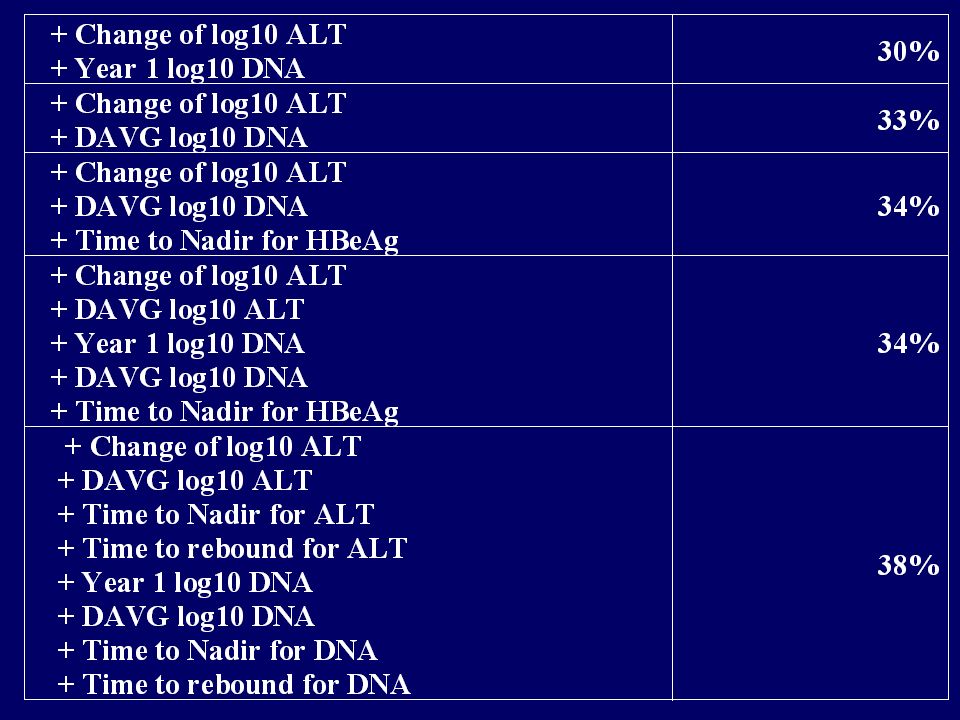
Predicting Change of Knodell *Excluding adefovir HBeAg negative study *stratified by study and treatment

56
Summary With near certainty, better response on change of log10 ALT and Year 1 log10 HBV DNA are associated with better Knodell improvement The associations are weak to moderate Multiple predictors do not improve much on top of ALT

57
Overview Summary of Efficacy Patient-level Correlation Trial-level Correlation Proportion of Treatment Effect Explained (PTE) Summary
 Summary")
58
Methods Studies were divided into smaller trials according to region and ethnic background to increase data points for analysis Size of “trials” range from 20 to 70.

59
HBV DNA vs. Knodell By Trial and Treatment

60
ALT vs. Knodell By Trial and Treatment

61
HBV DNA vs Knodell: Treatment effects by Trial R^2=25% (0, 60%)
")
62
HBV DNA vs Knodell: Treatment effects by Trial R^2=6% (0, 30%)
")
63
ALT vs Knodell: Treatment effects by Trial R^2=24% (0, 49%)
")
64
ALT vs Knodell: Treatment effects by Trial R^2=33% (8, 57%)
")
65
Variability and Correlation

66
Assume overall SD for Knodell is 3

67
Impact on relationship among treatment effects

68
Replication of a Single Trial r1=0.74 r0=0.31 R=0.56

69
Replication of a Single Trial r1=0.50 r0=0.47 R=0.44

70
Other considerations Variations in trial results are desirable for the trial-level correlation validation method. Two trials of different effect sizes are more useful than two trials of similar effect size

71
Overview Summary of Efficacy Patient-level Correlation Trial-level Correlation Proportion of Treatment Effect Explained (PTE) Summary
 Summary")
72
Proportion of Treatment Effect Explained Attempts to determine, of the total effect size observed for the Knodell score in each trial, how much can be attributed to the effect on the potential surrogate? –Linear regression model to determine how much effect remain when there is no effects on surrogate –The remainder portion of the treatment effect is considered mediated through surrogate Long used but also widely debated

73
PTE: HBV DNA vs Knodell

74
PTE: ALT vs Knodell

75
Overview Summary of Efficacy Patient-level Correlation Trial-level Correlation Proportion of Treatment Effect Explained (PTE) Summary
 Summary")
76
Treatment effects and variability for HBV DNA, ALT, HBeAg and Knodell score. –Baseline Knodell correlates with change –Effects over time for HBV DNA, ALT, and HBeAg –Both ALT and HBV DNA are variable over time

77
Summary Weak individual level correlation with Change of Knodell score –Year 1 HBV DNA, r = 0.3 –Change of ALT, r = 0.45 –Not much improvement with multiple predictors

78
Summary Weak Trial-level correlation –Biopsy variability may reduce individual correlation –Trial level correlation will be similar to individual level correlation if trials are similar –Adefovir and Epivir trial results are somewhat similar in effect sizes

79
Summary PTE for Year 1 HBV DNA and Change of ALT –For baseline HBeAg negative study, both HBV DNA and ALT have low PTE –For baseline HBeAg + Study, PTE are somewhat consistent in adefovir or lamivudine vs placebo comparisons –Interferon-containing comparisons are not informative

Similar presentations


 Specify an analysis plan that can be applied to a wide variety of clinical HIV resistance studies. B) Include both Intervention.>")


 Prof. Xinxin Zhang Rui Jin Hospital Jiao Tong University.>")

