Download presentation
Presentation is loading. Please wait.

1
Properties of Growing Networks Geoff Rodgers School of Information Systems, Computing and Mathematics

2
Plan 1.Introduction to growing networks 2.Static model of scale free graphs 3.Eigenvalue spectrum of scale free graphs 4.Results 5.Conclusions.

3
Networks Many of networks in economic, physical, technological and social systems have been found to have a power-law degree distribution. That is, the number of vertices N(m) with m edges is given by N(m) ~ m -
 with m edges is given by N(m) ~ m - .")
4
Examples of real networks with power law degree distributions NetworkNodesLinks/EdgesAttributes World-Wide WebWebpagesHyperlinksDirected InternetComputers and RoutersWires and cablesUndirected Actor CollaborationActorsFilmsUndirected Science CollaborationAuthorsPapersUndirected CitationArticlesCitationDirected Phone-callTelephone NumberPhone callDirected Power gridGenerators, transformers and substationsHigh voltage transmission linesDirected

5
Web-graph Vertices are web pages Edges are html links Measured in a massive web-crawl of 10 8 web pages by researchers at altavista Both in- and out-degree distributions are power law with exponents around 2.1 to 2.3.

6
Collaboration graph Edges are joint authored publications. Vertices are authors. Power law degree distribution with exponent ≈ 3. Redner, Eur Phys J B, 2001.

8
These graphs are generally grown, i.e. vertices and edges added over time. The simplest model, introduced by Albert and Barabasi, is one in which we add a new vertex at each time step. Connect the new vertex to an existing vertex of degree k with rate proportional to k.

9
For example: A network with 10 vertices. Total degree 18. Connect new vertex number 11 to vertex 1 with probability 5/18 vertex 2 with probability 3/18 vertex 7 with probability 3/18 all other vertices, probability 1/18 each.

10
This network is completely solvable analytically – the number of vertices of degree k at time t, n k (t), obeys the differential equation where M(t) = kn k (t) is the total degree of the network.
, obeys the differential equation where M(t) = kn k (t) is the total degree of the network.")
11
Simple to show that as t n k (t) ~ k -3 t power-law.
 ~ k -3 t power-law.")
12
Static Model of Scale Free Networks An alternative theoretical formulation for a scale free graph is through the static model. Start with N disconnected vertices i = 1,…,N. Assign each vertex a probability P i.

13
At each time step two vertices i and j are selected with probability P i and P j. If vertices i and j are connected, or i = j, then do nothing. Otherwise an edge is introduced between i and j. This is repeated pN/2 times, where p is the average number of edges per vertex.

14
When P i = 1/N we recover the Erdos- Renyi graph. When P i ~ i -α then the resulting graph is power-law with exponent λ = 1+1/ α.

15
The probability that vertices i and j are joined by an edge is f ij, where f ij = 1 - (1-2P i P j ) pN/2 ~ 1 - exp{-pNP i P j } When NPiPj 3, then f ij ~ 2NP i P j
 pN/2 ~ 1 - exp{-pNP i P j } When NPiPj 3, then f ij ~ 2NP i P j")
16
Adjacency Matrix The adjacency matrix A of this network has elements A ij = A ji with probability distribution P(A ij ) = f ij δ(A ij -1) + (1-f ij )δ(A ij ).
 = f ij δ(A ij -1) + (1-f ij )δ(A ij ).")
17
The adjacency matrix of complex networks has been studied by a number of workers Farkas, Derenyi, Barabasi & Vicsek; Numerical study ρ(μ) ~ 1/μ 5 for large μ. Goh, Kahng and Kim, similar numerical study; ρ(μ) ~ 1/μ 4. Dorogovtsev, Goltsev, Mendes & Samukin; analytical work; tree like scale free graph in the continuum approximation; ρ(μ) ~ 1/μ 2λ-1.
 ~ 1/μ 4. Dorogovtsev, Goltsev, Mendes & Samukin; analytical work; tree like scale free graph in the continuum approximation; ρ(μ) ~ 1/μ 2λ-1..")
18
We will follow Rodgers and Bray, Phys Rev B 37 3557 (1988), to calculate the eigenvalue spectrum of the adjacency matrix.
, to calculate the eigenvalue spectrum of the adjacency matrix.")
19
Introduce a generating function where the average eigenvalue density is given by and denotes an average over the disorder in the matrix A.

20
Normally evaluate the average over lnZ using the replica trick; evaluate the average over Z n and then use the fact that as n → 0, (Z n -1)/n → lnZ.
/n → lnZ.")
21
We use the replica trick and after some maths we can obtain a set of closed equation for the average density of eigenvalues. We first define an average [ …] ,i where the index = 1,..,n is the replica index.

22
The function g obeys and the average density of states is given by

23
Hence in principle we can obtain the average density of states for any static network by solving for g and using the result to obtain ( ). Even using the fact that we expect the solution to be replica symmetric, this is impossible in general. Instead follow previous study, and look for solution in the dense, p when g is both quadratic and replica symmetric.

24
In particular, when g takes the form

25
In the limit n 0 we have the solution where a( ) is given by
 is given by")
26
Random graphs: Placing P k = 1/N gives an Erdos Renyi graph and yields as p → ∞ which is in agreement with Rodgers and Bray, 1988.

27
Scale Free Graphs To calculate the eigenvalue spectrum of a scale free graph we must choose This gives a scale free graph and power-law degree distribution with exponent = 1+1/ .

28
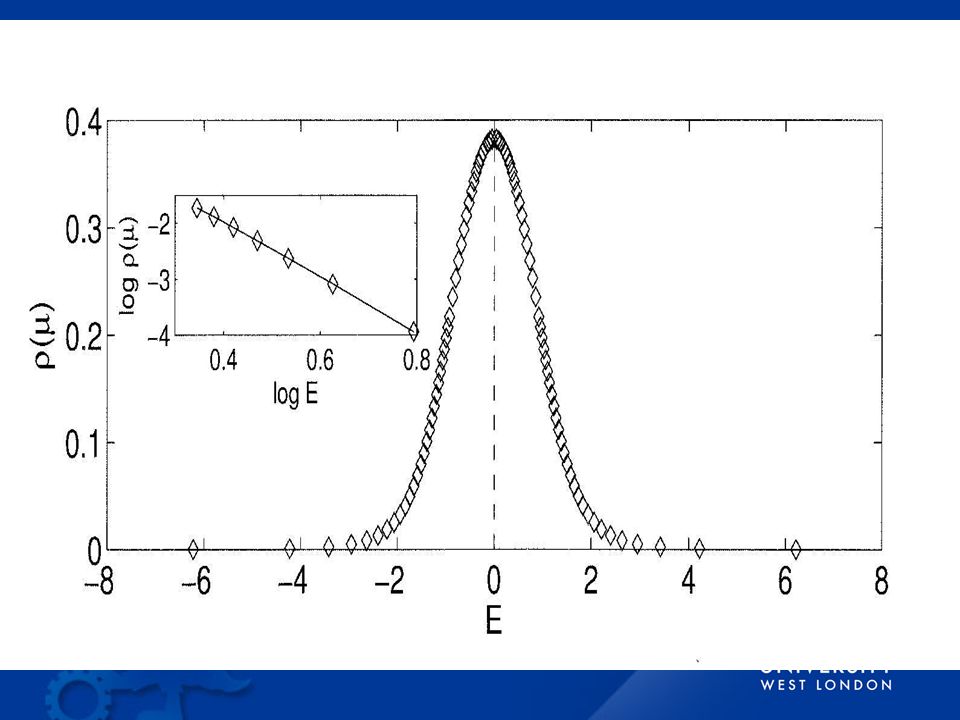
When = ½ or = 3 we can solve exactly to yield where note that

30
General Can easily show that in the limit then

31
Conclusions Shown how the eigenvalue spectrum of the adjacency matrix of an arbitrary network can be obtained analytically. Again reinforces the position of the replica method as a systematic approach to a range of questions within statistical physics.

32
Conclusions Obtained a pair of simple exact equations which yield the eigenvalue spectrum for an arbitrary complex network in the high density limit. Obtained known results for the Erdos Renyi random graph. Found the eigenvalue spectrum exactly for λ = 3 scale free graph.

33
Conclusions In the tail found In agreement with results from the continuum approximation to a set of equations derived for a tree-like scale free graph.

34
The same result has been obtained for both dense and tree-like graphs. These can be viewed as at opposite ends of the “ensemble” of scale free graphs. This suggests that this form of the tail may be universal. Conclusions

Similar presentations


 Mugizi Rwebangira.>")


. Réka Albert and AL Barabási,Statistical Mechanics.>")

 >")

