Download presentation
Presentation is loading. Please wait.

2
1.Messaging (Update) 2.ATDM Screening and Methodology Walkthrough 1.Primary 2.Secondary 3.Tertiary 3.Policy Issues for consideration 4.Next Steps 5.Questions Agenda
 2.ATDM Screening and Methodology Walkthrough 1.Primary 2.Secondary 3.Tertiary 3.Policy Issues for consideration 4.Next Steps 5.Questions Agenda")
3
Overarching Message Congestion can stifle Ohio’s economy and ruin your day. ODOT is looking at creative solutions to reduce traffic delays and improve safety. Recent studies show that congestion costs Ohio more than $3 billion a year. It is critical that we get people to work on time and that truckers and other commercial delivery drivers can travel our state efficiently via our road network. This is why ODOT is exploring Active Traffic and Demand Management (ATDM) strategies. These strategies may include managed lane techniques such as using shoulders to carry traffic during peak periods, displaying variable speed limits to keep vehicles moving through congestion and adding traffic signals to freeway entrance ramps (ramp metering). ATDM strategies have successfully increased travel time reliability on roads in other states. ODOT is currently evaluating where in Ohio active traffic and demand management strategies may be applicable, if at all, to benefit motorists, truckers, and the economy in a time of tight budgets.
 strategies. These strategies may include managed lane techniques such as using shoulders to carry traffic during peak periods, displaying variable speed limits to keep vehicles moving through congestion and adding traffic signals to freeway entrance ramps (ramp metering). ATDM strategies have successfully increased travel time reliability on roads in other states. ODOT is currently evaluating where in Ohio active traffic and demand management strategies may be applicable, if at all, to benefit motorists, truckers, and the economy in a time of tight budgets..")
10
ResourcesSource Capacity addition and/or resurfacingODOT TRAC/Transportation Plan From INRIX Bottleneck Report for OhioODOT Congestion and Safety Lists and DatabasesODOT Travel Time Reliability Index from ODOT - Top 10 per regionODOT Inside or outside shoulder widthODOT Basic Road Inventory Time savings to be worth the change in behavior or costModeling Commuting trips are longer rather than shorterModeling Relatively high percentage of through tripsModeling TIMS Right-of-way, Volumes, Speed, etc.ODOT Public support appears likelySurveys, Reports, Prior Project Public Meetings, News Papers, Ratio of travel time in peak period/travel time in free-flow2012 TTI Mobility Report by region Existing/Under Constr/Planned Managed Lanes/HOT LanesFHWA

23
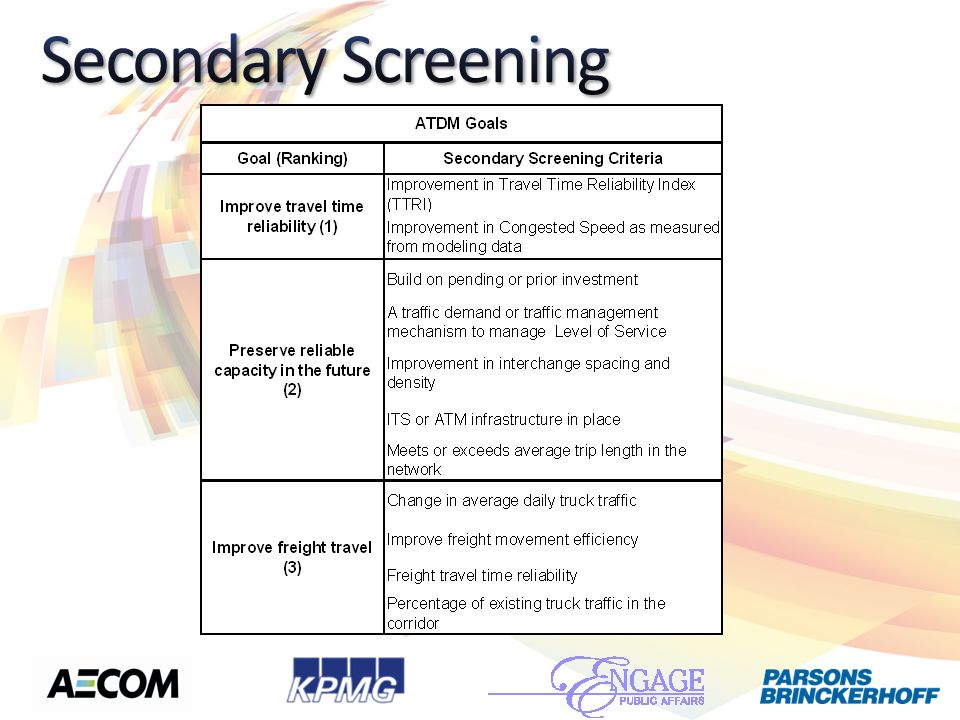
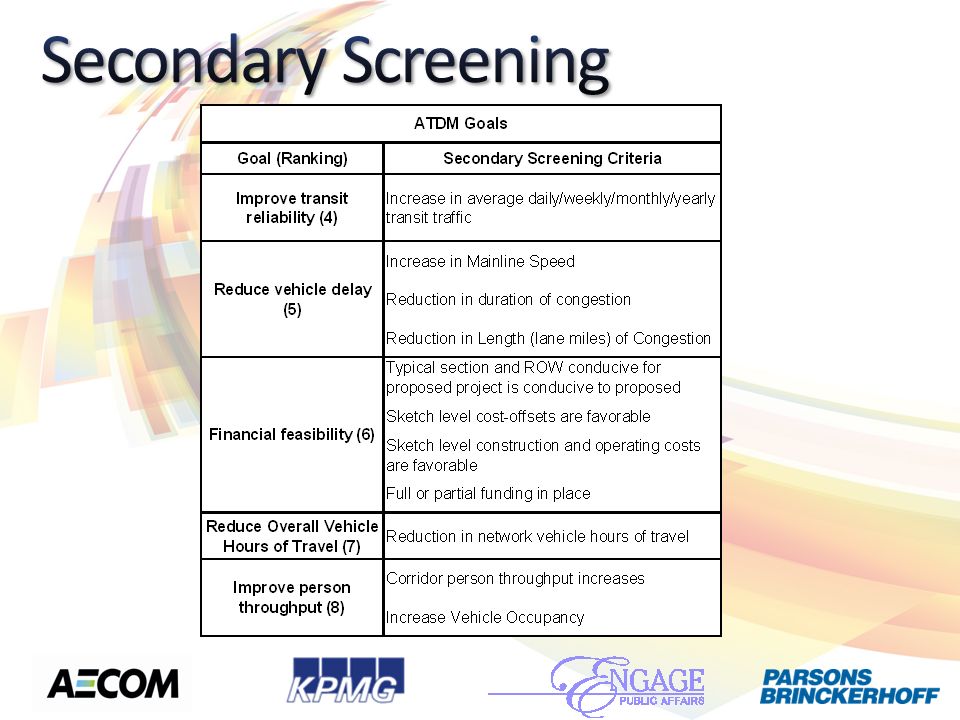
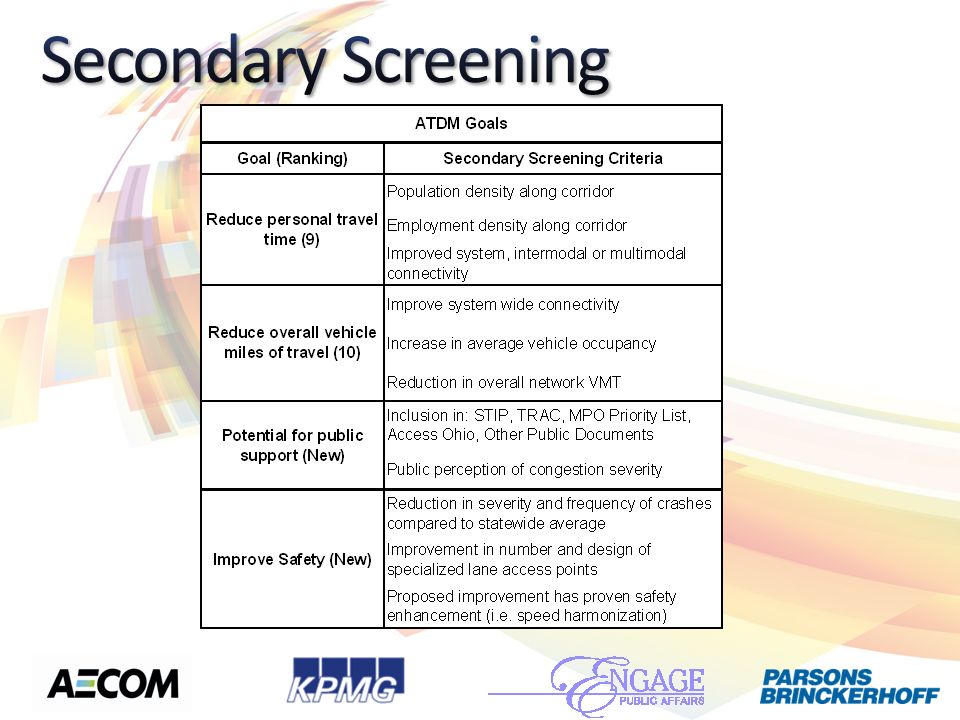
The activity during the secondary screening will involve use of the ODOT model to quantify the benchmarks previously described. The modeling phase will look at the interplay between benchmarks, to explore how separate projects in the same area may affect each other, Competitively (i.e., their interplay may depress their efficacy, according to the criteria used) Cooperatively (i.e., their interplay may lead to further improvement of their efficacy, according to the criterion used)
 Cooperatively (i.e., their interplay may lead to further improvement of their efficacy, according to the criterion used).")
24
Hard Shoulder Running Contra Flow Lanes High Occupancy Vehicle Lanes Bus Only Lanes Priced Lanes TMC Improvements Incident Response Integrated Corridor Management Truck Only Lanes Speed Harmonization Dynamic Message Signs providing real-time traffic information Dynamic Route Planning Ramp Metering Dynamic Lane Assignment Queue Warning

26
Develop a Preliminary B/C ratio Sketch level costs (and cost offsets) Traditional monetized benefits Traditional benefits may include (based on travel demand model outputs) Travel time savings (truck/auto) Travel time reliability (truck/auto) Emissions (reduced truck/auto VMT) Travel cost savings (reduced truck/auto VMT) Safety (reduced truck/auto VMT; crash reduction/increase with ATM/TDM) Identify opportunities for other benefits Qualitative More advanced monetized benefits (e.g. productivity/agglomeration gains, investments avoided, inventory savings)
.")
27
Dynamically manage recurrent and non- recurrent congestion Maximize effectiveness / efficiency Increase throughput and safety Integrated systems with new technology Automated dynamic deployment

28
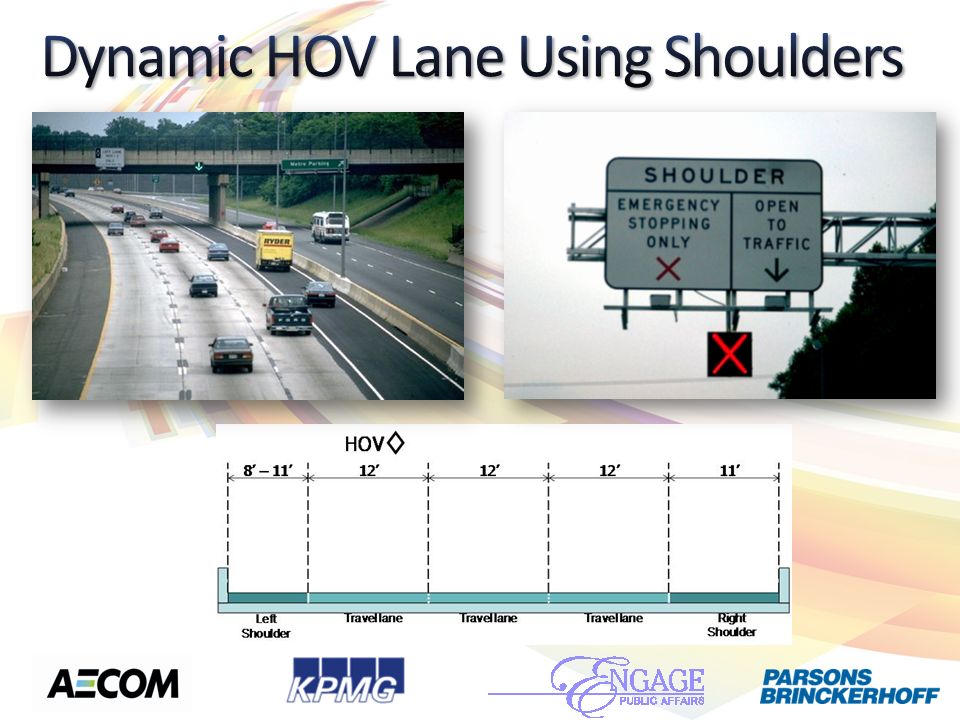
Individual Lanes Dedicated Shoulder Lanes Dynamic Shoulder Lanes All Traffic HOV Dynamic Shoulder Lanes Priced Dynamic Shoulder Lanes Junction Control All Lanes Speed Harmonization Queue Warning Dynamic Re-routing

29
● Congestion is an imbalance between ● Supply (highway lanes) ● Demand (highway travel) Equilibrium where Supply and Demand are in balance Equilibrium where Supply and Demand are in balance
 ● Demand (highway travel) Equilibrium where Supply and Demand are in balance Equilibrium where Supply and Demand are in balance")
30
● Congestion is an imbalance between ● Supply (highway lanes) ● Demand (highway travel) ● Unlimited demand yields overconsumption of supply ● Demand limited by fuel consumption, not location and time of use ● Outcome is economic scarcity
 ● Demand (highway travel) ● Unlimited demand yields overconsumption of supply ● Demand limited by fuel consumption, not location and time of use ● Outcome is economic scarcity")
31
Limited Capacity Limited Capacity Unlimited Demand Unlimited Demand Increase Capacity Increase Capacity Reduce Demand Reduce Demand Manage Access Manage Access 3 Options for Dealing with Scarcity

32
Practice shows congestion relief is temporary Does not fix the fundamental imbalance Cost to widen existing highways very expensive Build More Lanes Combination of rationing and trip avoidance Requires viable alternatives to travel Potentially impedes economic productivity Reduce Demand Does not accommodate significant travel growth Shifts economic burden to travelers Manage Existing Lanes

33
Application Expands capacity Shifts demand Meters traffic Outcome Restored travel speeds Improved safety Travel time reliability Long term Return on Investment

35
Land Use Employment

36
Corridor Performance Average throughput increase: 3 - 7% Overall capacity increase: 3 - 22% Decrease in primary accidents: 2 - 30% Decrease in secondary accidents: 40 – 50% System Use Benefits Overall smoothing of speeds during congestion Decreased headways and more uniform driver behavior Increase in trip reliability Delays the onset of freeway breakdown.

38
Typical uses: Add general purpose capacity (most) Add HOV capacity Limited use for auxiliary lanes, merge zones, lane balancing, uniform lane widths Most prominent in… California Texas Virginia Washington
 Add HOV capacity Limited use for auxiliary lanes, merge zones, lane balancing, uniform lane widths Most prominent in… California Texas Virginia Washington")
39
Typical Segment Dedicated SL Segment

40
I-35, Minneapolis, Minnesota

41
Implemented with speed harmonization Lane control signals for use of shoulder Refuge areas and call boxes also available Germany

43
Combines HOT Lane with Dynamic Shoulder Lanes Adapts to traffic via multiple operational conditions Germany

44
Applied at entrance ramps or merge points Main lane closed to provide priority to entering traffic

46
Delays onset of stop-and-go conditions Monitors conditions and deploys speed changes Reduces number of collisions

47
Complements existing DMS for incident management and travel time information Oriented towards informing of upcoming queues

48
Dynamic message signs Rotational prism signs Partnerships with information providers

49
Dynamic guidance signage

51
Top 12 ATDM Policies

52
12. ATDM strategies shall be selected and prioritized based on a structured and ODOT approved methodology. 11. ATDM strategies shall be considered as a component of selected corridor improvement projects as part of the NEPA process. 10. ATDM strategies shall consider improving the reliability of transit operations and freight movement as well as vehicular traffic. to 52

53
9. ATDM strategies shall support broader level ITS policies in terms of consistent incident, emergency and weather management systems. 8. The ODOT TMC shall be reconfigured to monitor and control ATDM technologies along selected corridors throughout the state. 7. ATDM strategies shall provide system connectivity with other modes and adjacent signal systems. to 53

54
6. Managed lanes shall maintain a minimum travel speed of 50 mph for 90 percent of the time over a consecutive six-month duration during weekday peak periods. 5. ATDM strategies shall promote the improvement of person throughput within selected corridors throughout the state. 4. ATDM strategies shall reduce the probability of primary and secondary crashes within selected corridors throughout the state. 54

55
3. ATDM strategies shall reduce traveler delays within selected corridors throughout the state. 2. ATDM strategies shall develop, monitor and report performance measures to gauge their effectiveness. 1. ATDM projects shall require development of a Concept of Operations, inclusive of realistic O&M budgets with funding commitments. 55

Similar presentations


 Analysis,>")


 Strategies, including Managed Lanes for Urban Corridors in Ohio Naveen Juvva.>")


 Innovative Design Considerations for All Users Module 8 Intersection- Interchange Evaluation Process.>")
