Download presentation
Presentation is loading. Please wait.

1
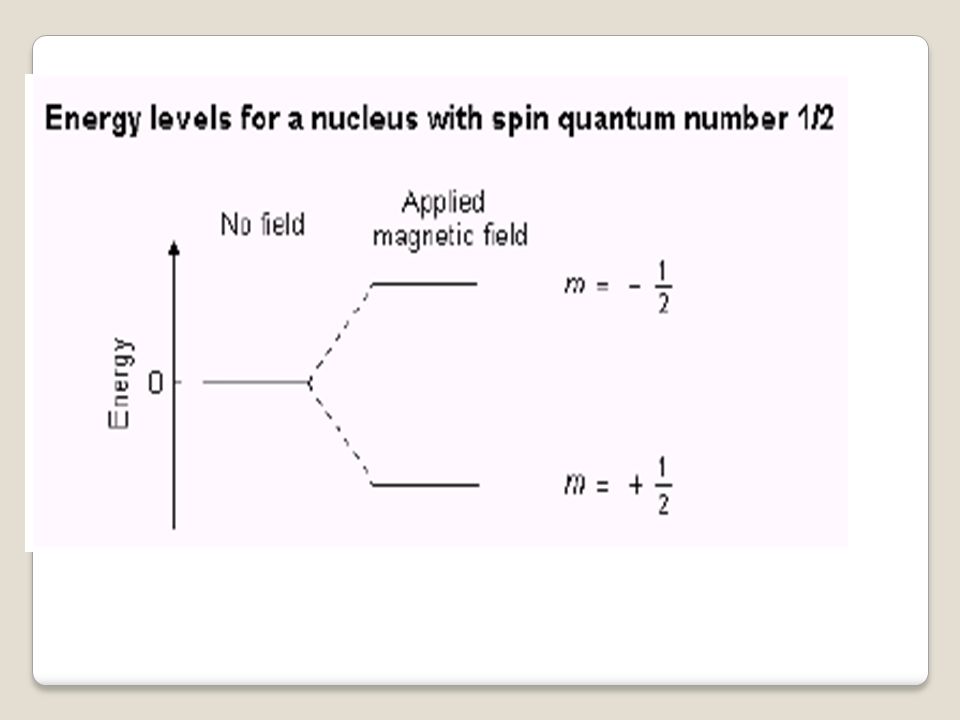
MR Spectroscopy is a technique for displaying metabolic information from an image. It relies on the inherent differences in resonant frequency or the chemical shift that exists due to different chemical environments. MR signal is measured and a spectrum plotting amplitude against frequency is displayed. By using a standard reference the chemical species of each peak can be determined.

5
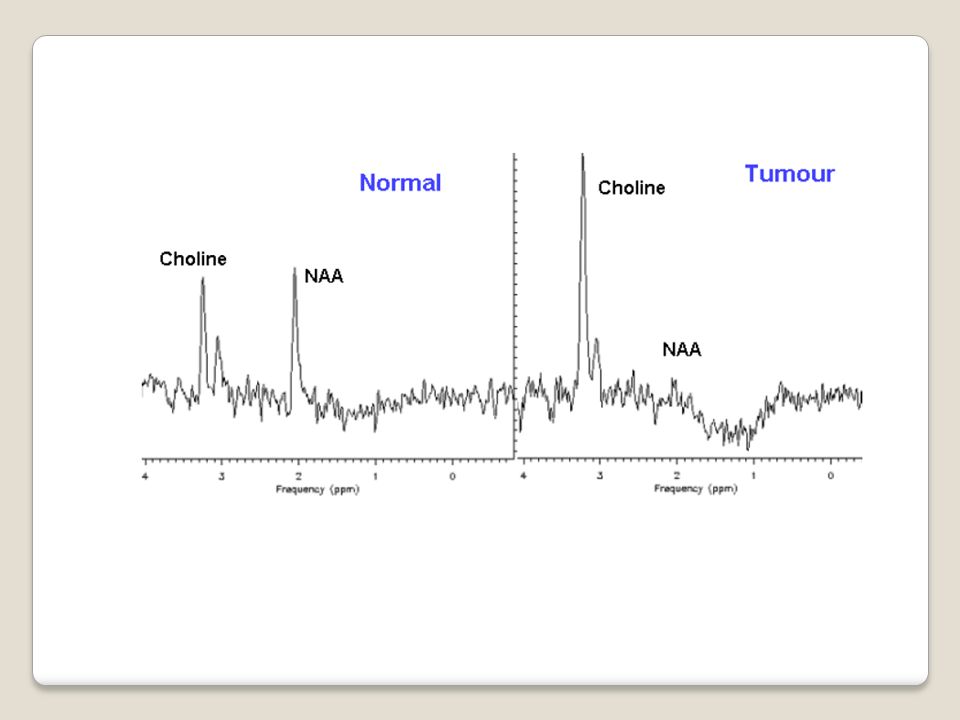
Chemical shift imaging Chemical shift imaging, is useful in isolating individual peaks and displaying the ntegrated area as a colour scale to produce a metabollic map. The example in the Figure below illustrates the potential clinical use of MRS. The spectrum on the left was acquired in normal healthy brain

6
tissue and displays the characteristic high N- Acetyl-Aspartate peak (NAA). On the right is a spectrum taken from a slightly enlarged but otherwise normal looking part of the Medulla. In this case the NAA peak is absent indicating loss of viable tissue, and the choline peak is elevated, which is indicative of the high cell proliferation in tumors.

8
Heart cells repolarize during the resting (diastole) phase of the heart cycle. Heart cells depolarize during the action that leads to contraction (systole) phase of the heart cycle. Heart function can be determined and defined by mean of electrocardiography (ECG) the source of ECG is the sum of action potentials in the heart muscle cells the recorded ECG provides information about the part of the heart that triggers each heartbeat, the nerve conduction of the heart and the rate and rhythm of the heart.
 phase of the heart cycle. Heart function can be determined and defined by mean of electrocardiography (ECG) the source of ECG is the sum of action potentials in the heart muscle cells the recorded ECG provides information about the part of the heart that triggers each heartbeat, the nerve conduction of the heart and the rate and rhythm of the heart..")
9
BIOELECTRCITY Human Electric Energy The brain is a super highway of electrical signals. It can process and deliver millions of messages to the entire infrastructure of the human body every second. At any given time, the human brain produces enough electrical current to power a 15– 20 watt light bulb.

10
Action Events of the Heart The heart acts as both an electrical and mechanical syncytium. That is, the heart cells act together to conduct bioelectricity and produce a contractile force due to depolarization that leads to contraction, Heart cells repolarize during the resting (diastole) phase of the heart cycle
 phase of the heart cycle.")
11
Human electricity energy is generated by chemical processes in nerve cells. Billions of nerve impulses travel throughout the human brain and nervous system. Membrane potential (also transmembrane potential or membrane voltage) is the difference in electric potential between the interior and the exterior of a biological cell.electric potentialcell
 is the difference in electric potential between the interior and the exterior of a biological cell.electric potentialcell.")
12
Differences in the concentrations of ions on opposite sides of a cellular membrane lead to a voltage called the membrane potential.ionscellular membranevoltage When describing bioelectric currents, we often use a derivation of Ohm’s law: J= where J = current density, amps/m2 σ = medium conductivity, Siemen's/m E = electric field, volts/m

13
Thus approximately 10 23 sodium ions, for example, moving in one direction each second will produce an electric current of 1 A.

14
. The first wave of the ECG, designated P, represents initiation of the heartbeat in the upper chambers of the heart (atria). The QRS complex represents movement of the electrical current through the lower chambers of the heart (ventricles). The T wave represents the recovery phase, in which the electrical current spreads back over the ventricles in the opposite direction.
. The T wave represents the recovery phase, in which the electrical current spreads back over the ventricles in the opposite direction..")
15
Capacitors 1- A capacitor is a device for storing charge. 2- It is usually made up of two plates separated by a thin insulating material known as the dielectric. 3- One plate of the capacitor is positively charged, while the other has negative charge. 4- The charge stored in a capacitor is proportional to the potential difference between the two plates.5- For a capacitor with charge Q on the positive plate and -Q on the negative plate, the charge is proportional to the potential: If C is the capacitance, Q = CV The capacitance is a measure of the amount of charge a capacitor can store;

16
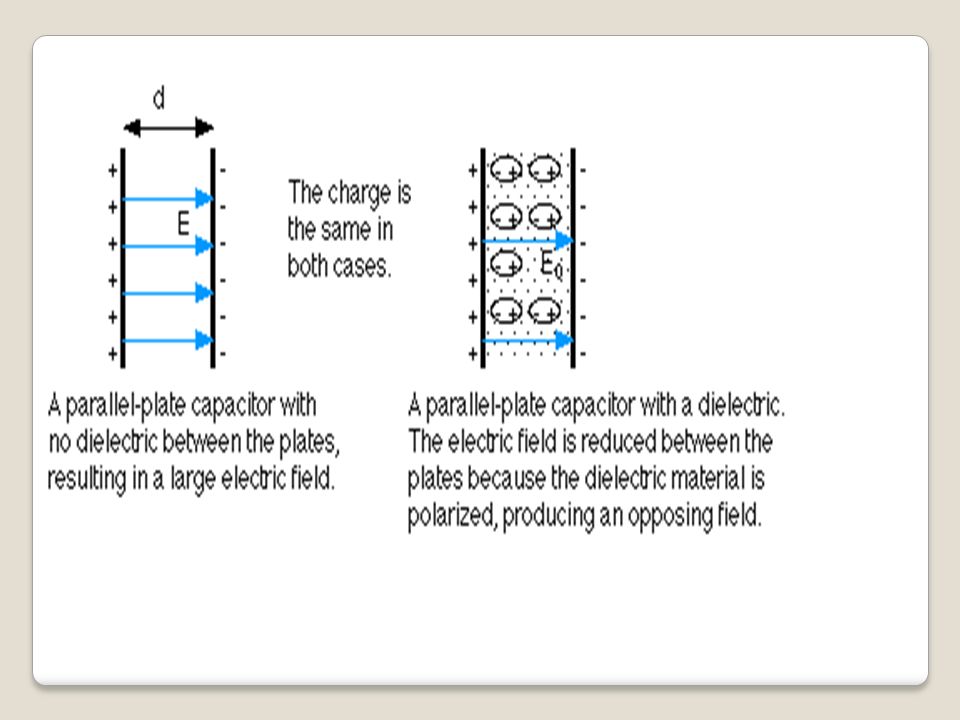
Energy Stored in capacitors for a set of parallel plates, the electric field between the plates is related to the potential difference by the equation: for a parallel-plate capacitor: E = V / d For a parallel-plate capacitor with a dielectric between the plates, PE = 1/2 Q V. Substituting in for Q, Q = CV, gives: The energy stored in a capacitor is: U = 1/2 C V 2 :

17
. FIGURE.6 Nernst potentials arise across semipermeable membranes due to opposing forces of electric field and diffusion

18
a cellular TMP of -70 mV creates an electric field of 107 V/m across the membrane. In air, electric breakdown would occur and would produce lightning-bolt-sized discharges over meter-order distances. Electric breakdown is resisted in the microcellular environment by the high dielectric qualities of the cell membrane.

19
The dielectric constant is the ratio of the electric field without the dielectric to the field with the dielectric:

Similar presentations


, the atrioventricular node.>")
