Download presentation
Presentation is loading. Please wait.

1
12.1 Measures of Central Tendency Objectives: Find the mean, median, and mode of a data set. Find ore estimate the mean from a frequency table of data. Standards: 2.6.8A. Compare and contrast different plots of data using values of mean, median, mode, and range.

2
3 commonly used measures of central tendency are the mean, median, and mode.

3
HIGHEST NUMBER MINUS LOWEST NUMBER

4
RANGE = 20 – 7 = 13

5
Ex 1. Using the data 40, 45, 39, 40, 41, 42, 37, 41, 41, 40, find the measures of central tendency (mean, median, and mode), and compare them. RANGE = 45 – 37 = 8
, and compare them. RANGE = 45 – 37 = 8.")
6
Ex 2. Using the data 88, 74, 98, 76, 68, 74, 89, 92, find the measures of central tendency, and compare them. Mean = 82.375 Median = 82 Mode = 74 Range 98 – 68 = 30 Mean and Median are very close, where as the mode is lower.

8
Ex 4. Last month, 6 houses were sold in Souderton. The sale prices were as follows: $140,000, $165,000, $150,000, $300,000, $146,000, and $125,000. Find the mean, median, and mode of the sale prices. Explain which measure best represents the typical sale price of a house in Souderton last month. Mean = 171, 000 Median = 148, 000 Mode = None Range = 175,000 Median represents the typical sale price of a house in Souderton.

9
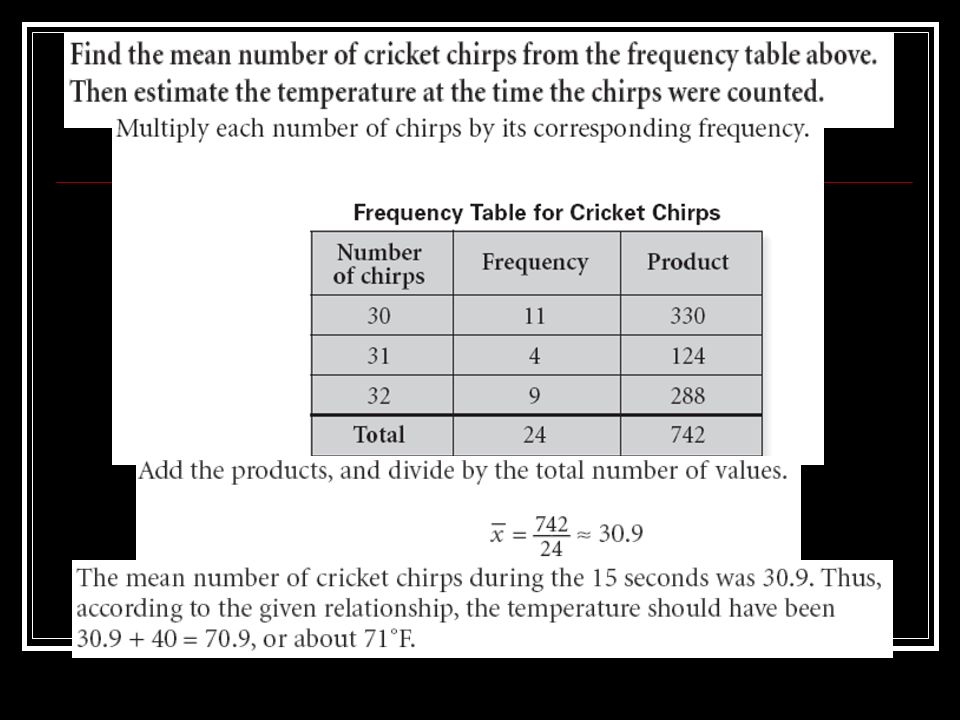
II.To make a frequency table, first list each distinct value. Then make a mark for each value in the data set. Finally, count the number of marks to get the respective frequency for each value, as shown below. The number of chirps that a cricket makes is related to the temperature. To verify this relationship, a class of 24 students counted cricket chirps for 15 seconds with the following results:

11
* Ex 2. Make a frequency table for the data below on the # of books read by 30 students last month. Then use your frequency table to find the mean. 4, 0, 1, 2, 6, 0, 1, 2, 0, 4, 0, 2, 2, 1, 1, 3, 1, 0, 3, 2, 0, 1, 2, 2, 4, 1, 1, 1, 0, 4 # BooksFrequencyProduct 0 1 2 3 4 5 6 Total

12
III. When there are many different values, a grouped frequency table is used. A grouped frequency table, the values are grouped into classes that contain a range of values.

13
*Ex 1. The grouped frequency table at right lists the results of a survey of 80 musicians who were asked how many hours per week they spend practicing. Estimate the mean # of hours that these musicians practice each week. HoursClass MeanFrequencyProduct 1-513 6-109 11-159 16-2014 21-2516 26-308 31-358 36-403 Total

14
*Ex 2. The grouped frequency table lists the numbers of CDs bought by 50 students last year. Estimate the mean # of CDs bought by these students last year. # CDsClass MeanFrequencyProduct 04 1-514 6-109 11-1510 16-208 21-251 26-302 31-351 36-401 Total

15
Writing Activities

16
Review of the Measures of Central Tendency

Similar presentations


 3, 4, 7, 3, 5, 2, 6, 10 (b) 8, 10, 12, 14, 7, 16, 5, 7, 9,11 (c) 64, 66, 65, 61, 67, 61,>")


2, 3, 3, 3,>")