Download presentation
Presentation is loading. Please wait.

1
Using SPSS Next

2
An Introduction SPSS (the Statistical Package for the Social Sciences)
")
3
SPSS SPSS has three parts/windows: Data where you enter the data (.sav) Syntax where details of the analyses you are going to do are displayed (.sps) Viewer/Output where the results are displayed (.spo) any messages (such as errors) are displayed in this window
 Syntax where details of the analyses you are going to do are displayed (.sps) Viewer/Output where the results are displayed (.spo) any messages (such as errors) are displayed in this window")
4
SPSS You must always have a data window open, and you do not have to use the syntax window If an output window is open, messages appear in this, and it remains where it was (e.g. behind the data screen)
.")
5
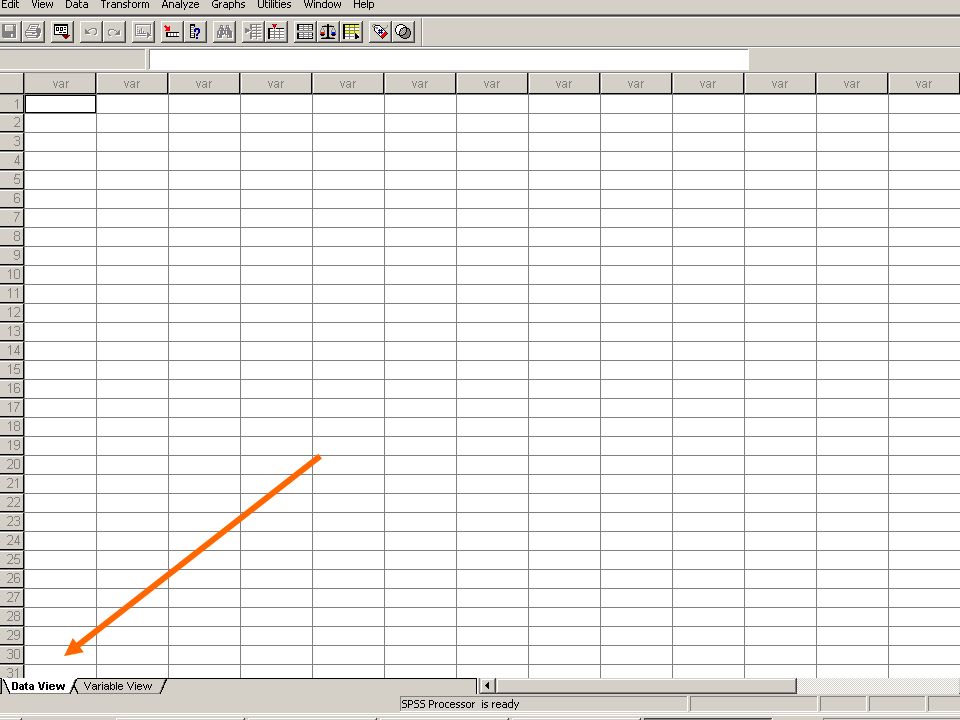
Opening SPSS When you open SPSS, a data window will open At the bottom are two tabs: data view: gives title of each variable at top, and allowsyou to enter your data, case by case variable view: gives the details of each variables, and allows you to define/describe the variables in your research e.g., in a questionnaire survey: the variables are the questions you want to enter data under and go along the top the cases are the people who returned questionnaires and go down the side

8
USING SPSS Set up data sheet Enter data Run analyses

9
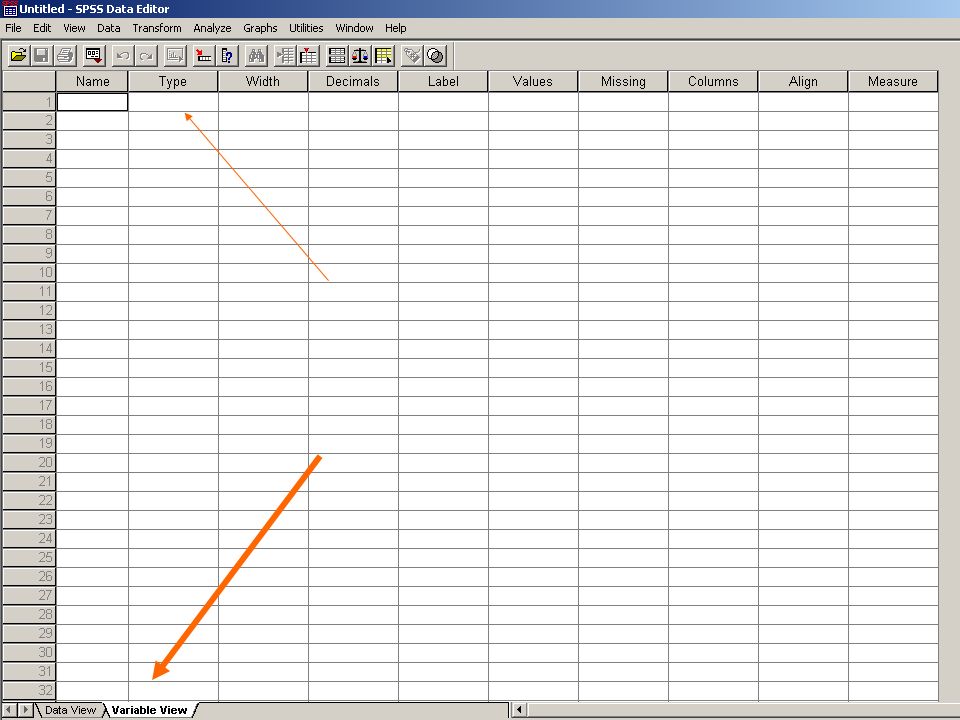
STEP 1: Set up a data sheet This step involves defining/describing the variables of your research. Ensure you are in variable view (tab at bottom of window) Enter name of variable must start with a letter and contain no spaces (but can contain numbers and symbols) can be up to 8 characters in length After you have created a variable (through entering its name), the rest of the options appear
 Enter name of variable must start with a letter and contain no spaces (but can contain numbers and symbols) can be up to 8 characters in length After you have created a variable (through entering its name), the rest of the options appear.")
10
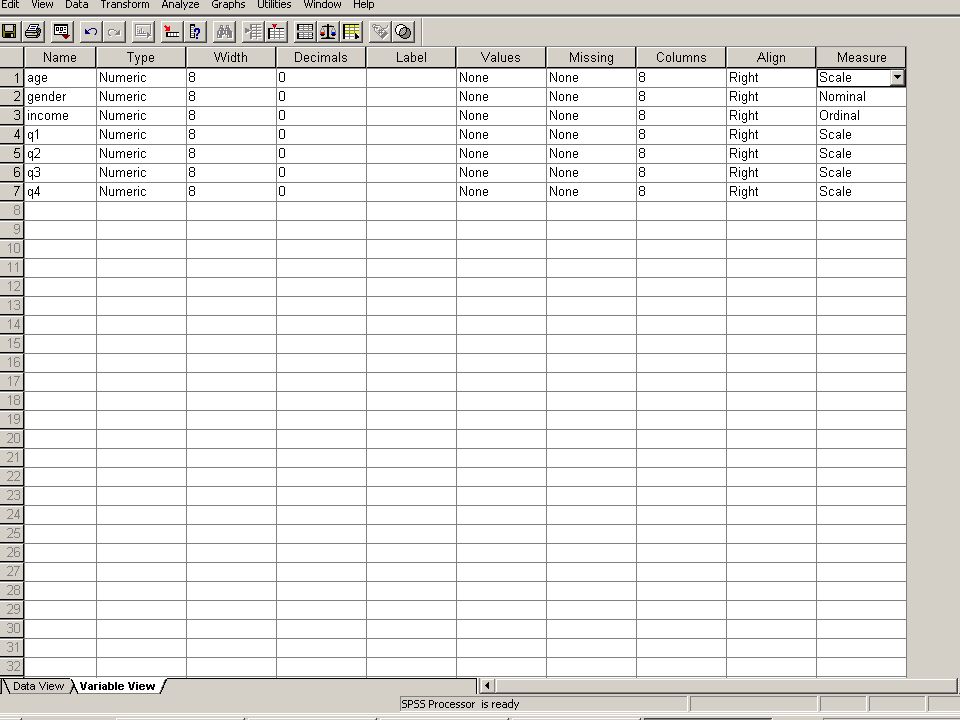
STEP 1: Set up a data sheet Define/describe variable Click on the cell you wish to change and one of three things will appear: blank cell (type whatever you want) numbers with up/down arrows (adjust till preferred option appears) word (e.g., name, right, scale; when select cell, a box with dots appears right - click on this for more options
 numbers with up/down arrows (adjust till preferred option appears) word (e.g., name, right, scale; when select cell, a box with dots appears right - click on this for more options")
12
Step 1: Set up a data sheet Typetype of variable (numeric, string etc) widthhow many characters do you want to be able to enter decimalshow many decimal places do you want labelfull name for the variable valueslabels for variables (e.g., 1=male, 2=female) missingallows you to determine which numbers will be treated as missing data when doing analyses columnsdefines how wide the column display is alignmenthow do you want the columns to align measureoptions of scale (ordinal, nominal)
 widthhow many characters do you want to be able to enter decimalshow many decimal places do you want labelfull name for the variable valueslabels for variables (e.g., 1=male, 2=female) missingallows you to determine which numbers will be treated as missing data when doing analyses columnsdefines how wide the column display is alignmenthow do you want the columns to align measureoptions of scale (ordinal, nominal)")
13
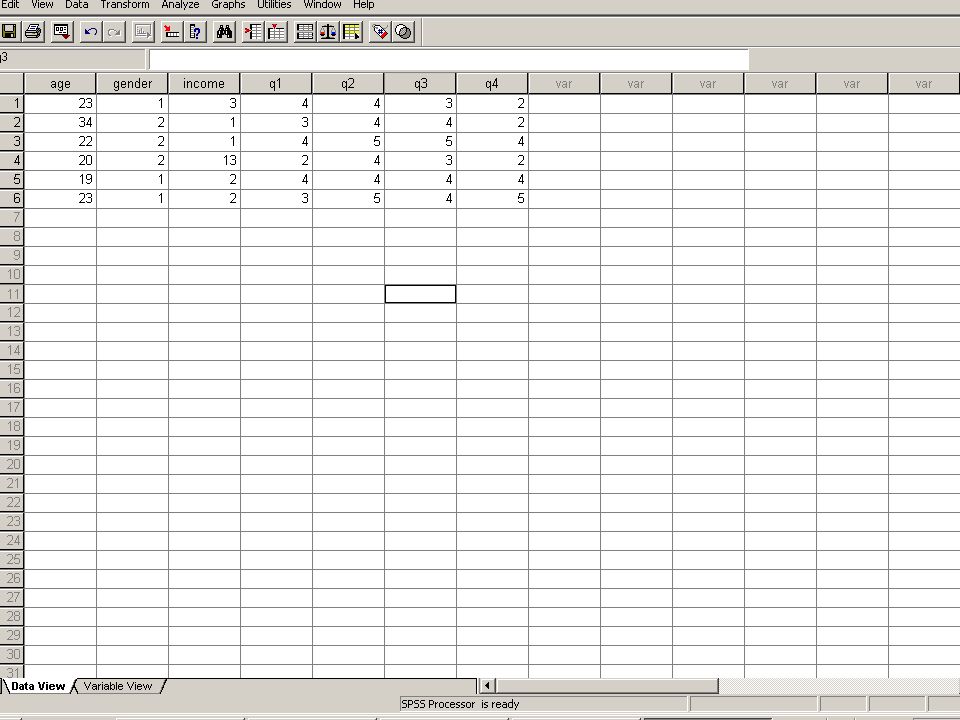
Step 2: Enter data entering data is very similar to entering data into excel (and data can be copied between excel and SPSS) the type of variable you have chosen will effect what you may enter (e.g. numbers vs letters) you can’t type letters into a numeric variable, but can type numbers into a string variable use arrows or tab key to move - if you use tab then when reach the end of the row will return to the start of the next one you can cut and paste within SPSS you can sort cases (data/sort cases) you can insert variables or shift the order of variables (data/insert variable)
 you can’t type letters into a numeric variable, but can type numbers into a string variable use arrows or tab key to move - if you use tab then when reach the end of the row will return to the start of the next one you can cut and paste within SPSS you can sort cases (data/sort cases) you can insert variables or shift the order of variables (data/insert variable).")
15
Step 3: Analyses decide what analyses to do using menus under analyze usually will choose type of analysis, then which variables you wish to include variables are displayed by their variable label (with the variable name in brackets), in the order they are in the data window will also get options specific to each analysis, such as the type of information you want included, or the specific tests you want done then have choice of OK (run analysis)
, in the order they are in the data window will also get options specific to each analysis, such as the type of information you want included, or the specific tests you want done then have choice of OK (run analysis)")
16
Descriptive analysis

17
Descriptives

18
Clicking option

19
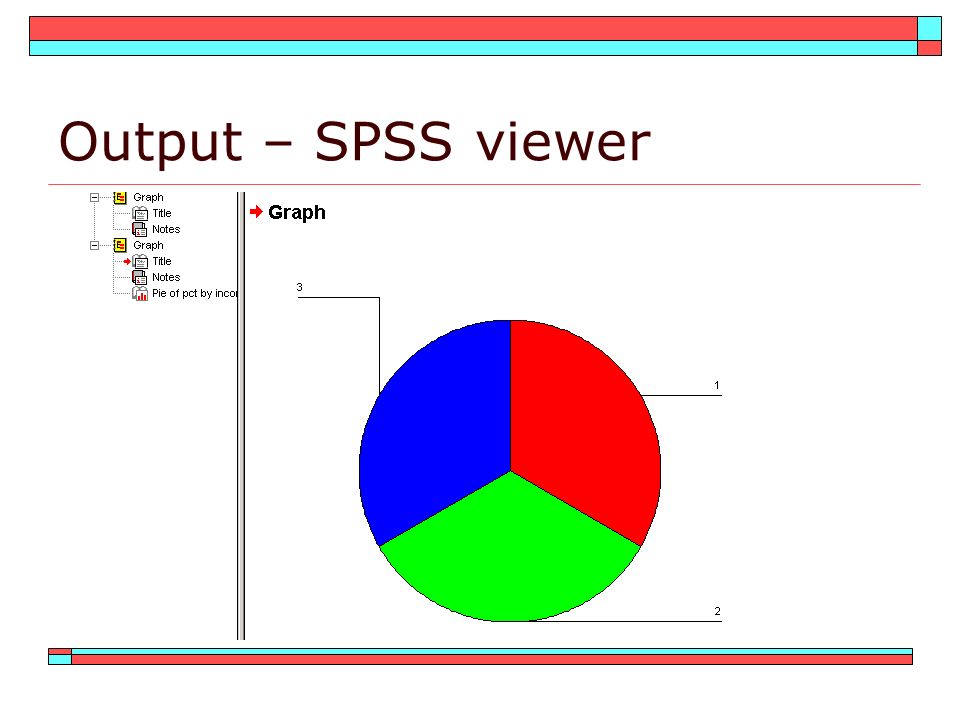
Output In the output window the results of the analysis are displayed the column to the left has a summary of the analyses/messages, the one on the right the actual analyses/messages analyses can be selected in either column you can adjust headings by double clicking on the titles in either column - however it only changes in the column in which you selected it. If you wish to add headings before printing, make changes in the right hand column

20
Output – SPSS viewer

22
Determining Reliability Recall Reliability is defined as the ability of a measuring instrument to measure the concept in a consistent manner To determine Split half analysis- answers on the first half of the questionnaire are compared to the second half of the questionnaire If there is a high correlation – internally consistent / reliable

23
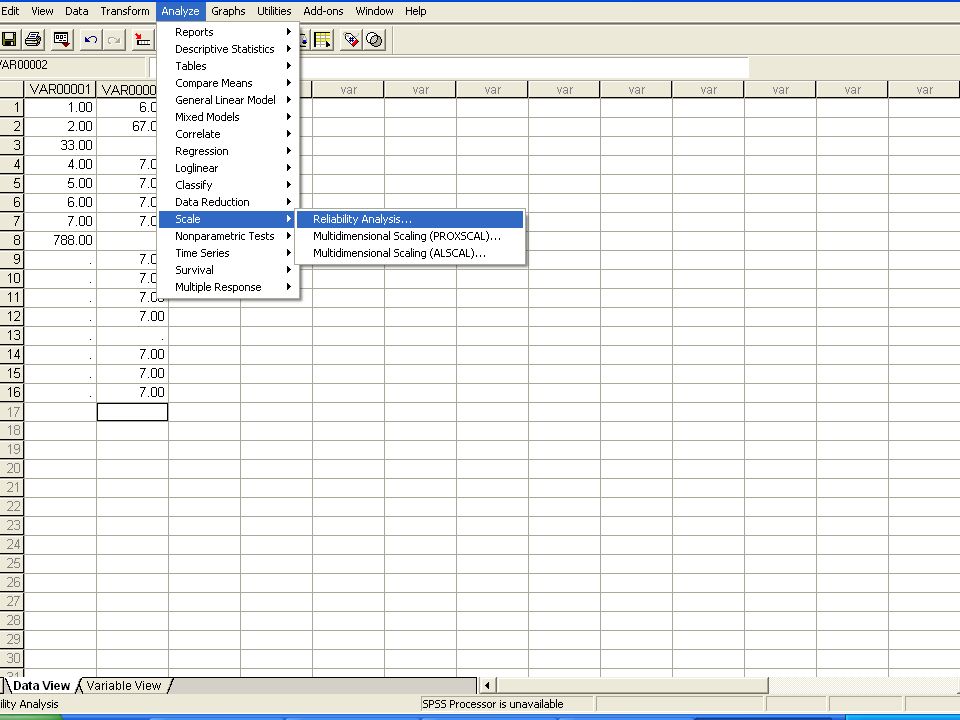
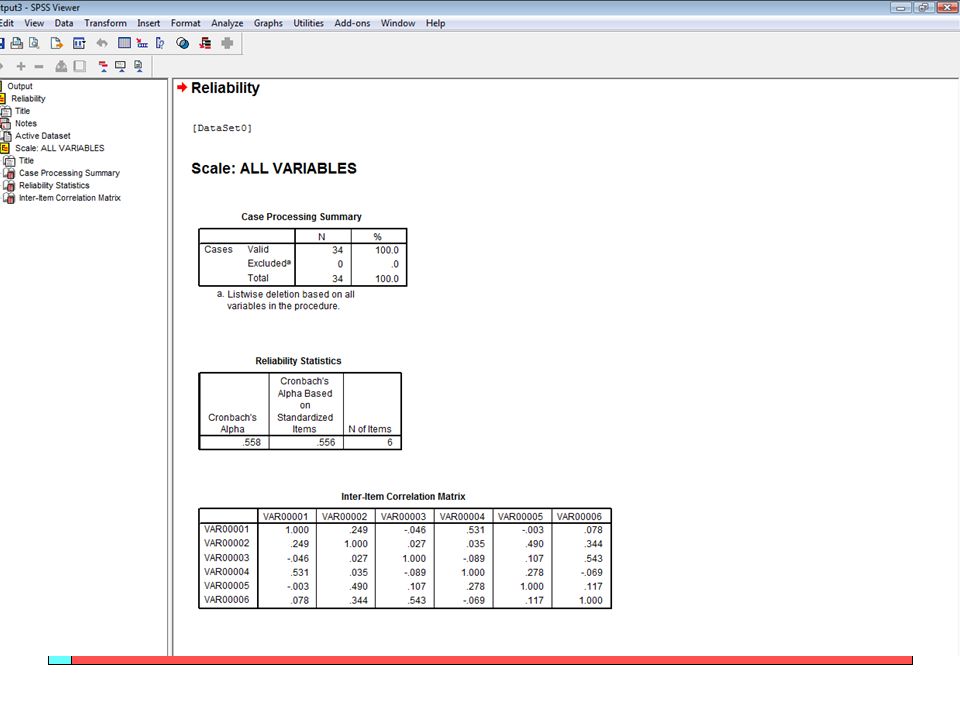
Determining Reliability Coefficient Cronbach’s Alpha Examines average inter item correlation of the items in the questionnaire If all items measuring the exact same thing, = 1 = 0.7 or more – reliable Use SPSS

25
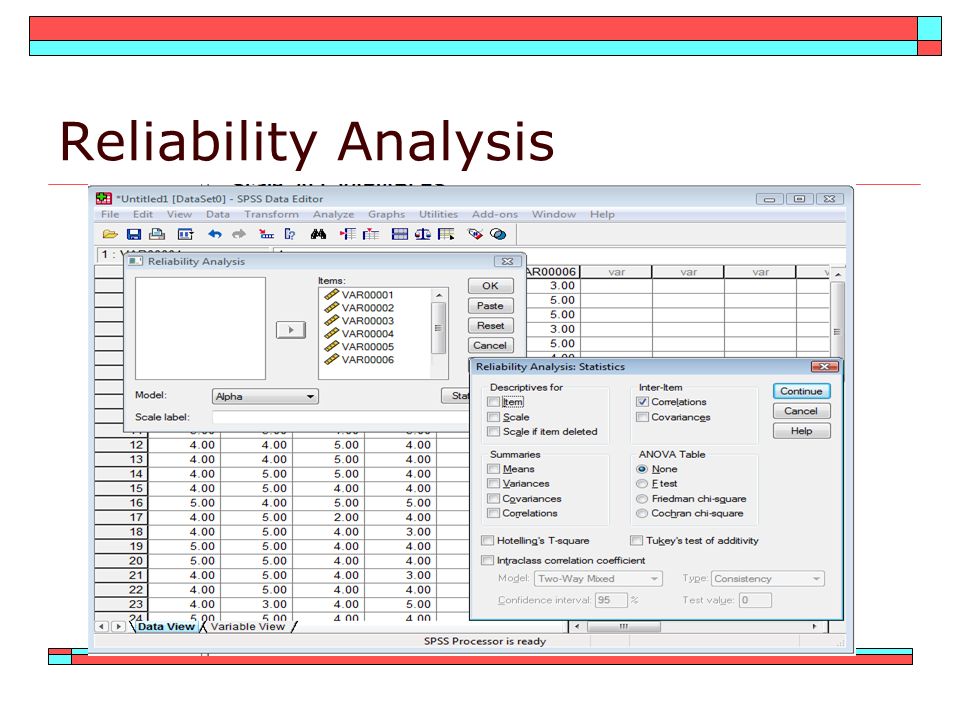
Reliability Analysis

28
Crosstabulation While frequencies show the numbers of cases in each level of a categorical variable, they do not give information about the relationship between categorical variables. number of male and female students in a faculty the number of students in each program not the number of male or female in a program Crosstabs procedure is useful for investigating information about the intersection of two variables. The number of male and female students in each of three programs

29
Crosstabulation SPSS - Analyze menu in the Data Editor window Analyze Descriptives Crosstabs (gender and employment category)
")
30
Crosstabulation Options there appears to be an association between gender and employment category

31
Next: Inferential Statistics Used to infer to a larger population To generalize to a larger population

Similar presentations
. Is a spreadsheet application designed to take advantage of the windows graphical interface MICROSOFT EXCEL.>")


 and dependant (Y) variables.>")


 Commonly used statistical software.>")

