Download presentation
Presentation is loading. Please wait.

1
Attitudes and beliefs in PISA 2006 FINLAND 30.08.2008 Jarkko Hautamäki

3
Response tendencies of Finnish and Normative OECD students Interest in science 1 Strongly agree, 2 Agree, 3 Disagree, 4 Strongly disagree Frequency distribution, percentages (%)
")
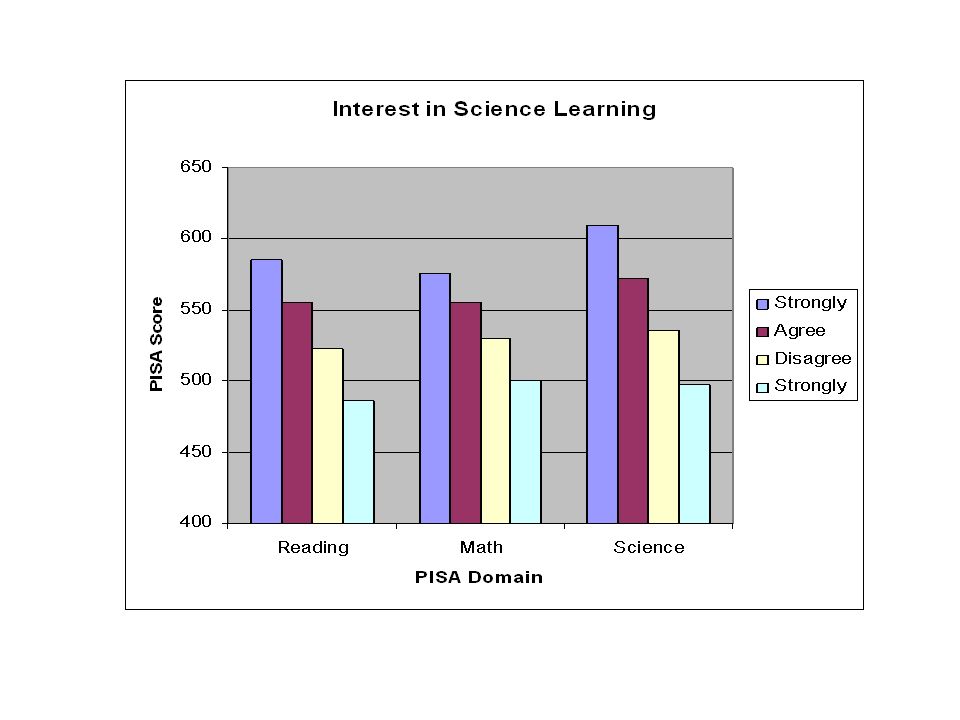
4
OECD average Finland 1: Reading 2: Mathematics 3: Science Colours: interest in science learning strongly agree, agree, disagree, strongly disagree

5
Scale: oecd mean 0, sd=1 MeanSD Statisticse General value of science.07.01.89 General interest in learning science -.24.01.94 Future oriented science motivation -.17.01.86

6
oecd mean 0, sd=1 MeanSD Statisticse Personal value of science -,09,01,88 Enjoyment of science,11,01,89 Science self-efficacy,03,01,92 Science self concept,07,01,85

7
OECD mean = 0, SD =1MeanSe SD Awareness of environmental issues -.02.02.86 Environmental optimism.00.01.85 Perception of environmental issues -.52.01.83 Responsibility for sustainable development -.10.02 1.02

8
Items of the index of students’ level of (serious) concern for environmental issues, perception of environmental issues (source, Figure 3.19, OECD 2007a, p. 159) (%) ItemFinnish%OECD% Air pollution 8892 Extinction of plants and animals7484 Clearing of forests for other land use7683 Energy shortage6782 Nuclear waste7478 Water shortage4576
 (%) ItemFinnish%OECD% Air pollution 8892 Extinction of plants and animals7484 Clearing of forests for other land use7683 Energy shortage6782 Nuclear waste7478 Water shortage4576.")
9
Mean Interest in science488 Support for scientific inquiry479 COMPETENCE-components Explaining scientifically566 Identifying scientific issue555 Using scientific evidence567

10
r Interest in science0.21 -0.00 Support for scientific inquiry0.35 0.04 Explaining scientifically0.88 0.38 Identifying scientific issue0.83 0.14 Using scientific evidence0.84 0.35

11
Compe- tence Interest in science READ SCIENCE MATH Interest 0.39 0.85 0.210.230.16 Support 0.55 0.71 0.420.390.28 Explaining 0.95 -0.150.760.950.84 Identifying 0.92 -0.200.830.910.80 Using 0.96 -0.190.830.960.87 Science competence (1st PC)1.000.00 0.840.970.85 Interest in science (2nd PC)0.001.00 -0.10-0.18-0.22
 Interest in science (2nd PC)")
12
Compe- tence Interest in science READ SCIENCE MATH Interest 0.39 0.85 0.210.230.16 Support 0.55 0.71 0.420.390.28 Explaining 0.95 -0.150.760.950.84 Identifying 0.92 -0.200.830.910.80 Using 0.96 -0.190.830.960.87 Science competence (1st PC)1.000.00 0.840.970.85 Interest in science (2nd PC)0.001.00 -0.10-0.18-0.22
 Interest in science (2nd PC)")
13
SYMBOLIC MAPS which are based on multidimensional analysis of item frequencies and constructing a n- dimensional matrix of similarity/dissimilarity using symbolic data analysis software, SODAS countries positions are projected on a bi- dimensional map dimensions are not normally interpreted, only the relative positions, the configuration, is given

14
Bi-dimensional symbolic map of 30 OECD countries based on science competence components (explain, identify, use)
")
15
Bi-dimensional symbolic map of 30 OECD countries based on science attitudes (interest, support)
")
16
Bi-dimensional symbolic map of 30 OECD countries based on environmental questions 22,24,25 and 26 of PISA student questionnaire

17
Bi-dimensional symbolic map of 30 OECD countries based on science attitudes (interest, support) and competence components (explain, identify, use)
 and competence components (explain, identify, use)")
18
Bi-dimensional symbolic map of all PISA participating countries based on science attitudes (interest, support)
")
19
All PISA 06 countries two indexes of science attitudes, & three indexes of science competence components

Similar presentations


 Physicians Patthida Maroongroge, D.D.S.*, Rose L.>")


>")

>")


 Evaluate human behaviors in terms of how likely they are to ensure the ability to live sustainably on Earth.>")