Download presentation
Presentation is loading. Please wait.

1
Mapping the Dementias in NSW: A GIScience Approach Authors: H. Robertson, GA (Tony) Broe and N. Nicholas Ageing Research Centre Prince of Wales Hospital Email: robertsonh@sesahs.nsw.gov.aurobertsonh@sesahs.nsw.gov.au Ph: 02-93824594
 Broe and N. Nicholas Ageing Research Centre Prince of Wales Hospital Ph:")
2
Contents The dementias and issues of scale Practical implications for monitoring and service delivery Using GI Science and GIS in particular Adding value to past and present clinical research Applying new methods to existing data

3
Objectives in Using GIScience Translating clinical research to population outcomes and Sharpening the focus of questions and research for the future Adding value to clinical data for researchers, planners and the community Linking multiple data sets and research outcomes to look at problems afresh Empowering communities and communities of interest to plan and advocate more successfully

4
GIS Applications Infectious disease mapping eg. Snow Public health mapping eg. 9/11 toxic plume Health service access – spatial access Theorising disease aetiology eg. MND/Sabel Investigating gene-environment interactions Poorly utilised in ageing research - Hirschorn

5
GIS and MND/ALS

7
Actual and Projected Population 85+ 2001-2050 Source: The Demographer’s Workshop

9
Projected Milestones for the “Old Old” 2014 0.5 million people 85+ 2031 1 million 2037 1.5 million 2043 2.0 million 2049 2.5 million

13
Some Reasons to Map Dementia Variations occur across space in terms of population and infrastructure Importance of location for services eg. MOW Importance for modelling patient and carer needs eg. respite care demand Add a spatial dimension to the issue eg. remoteness/distance etc Localise the issues faced in different places

14
Formal Service Utilisation in SOPS 1

15
WARNING Most data used in the following maps and tables are provisional results only and we suggest you make contact with the authors prior to any use of these maps and tables.

16
Informal Services Utilised SOPS 1 (Selected)
")
17
Disability Aids Owned SOPS 1

18
Rough Dementia Estimate and Projections

19
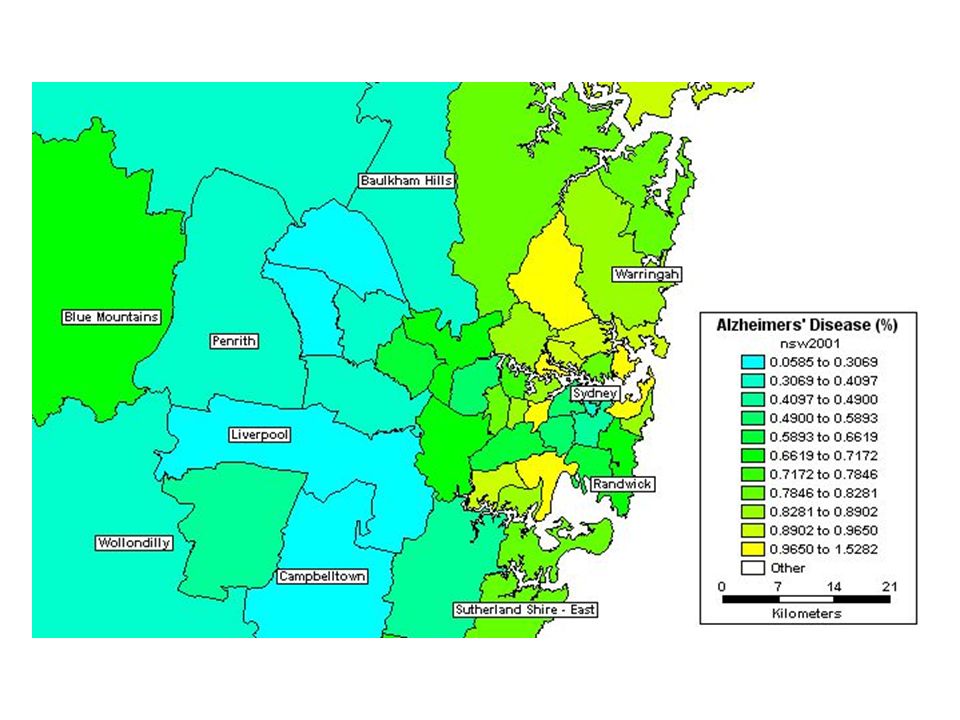
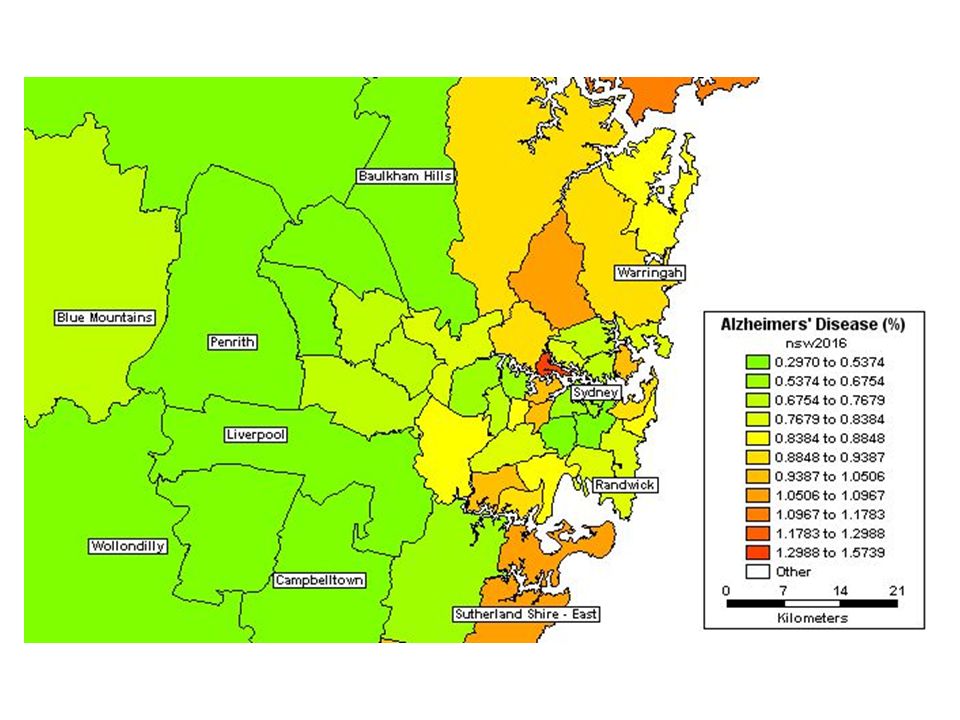
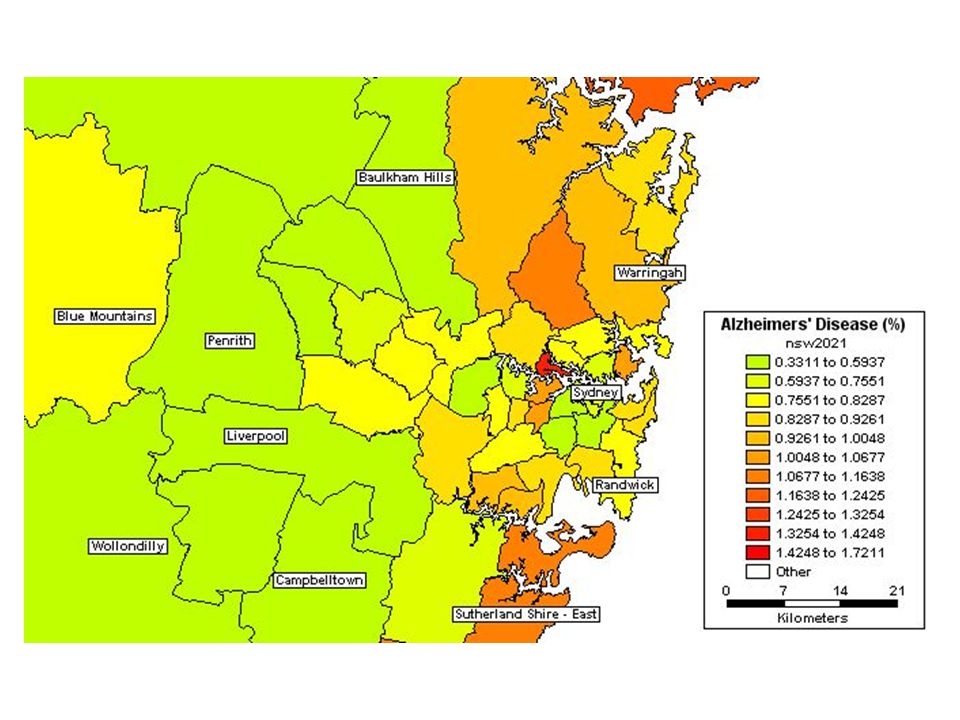
Current 85+ in Metropolitan Sydney

20
Eastern Suburbs, Sydney

21
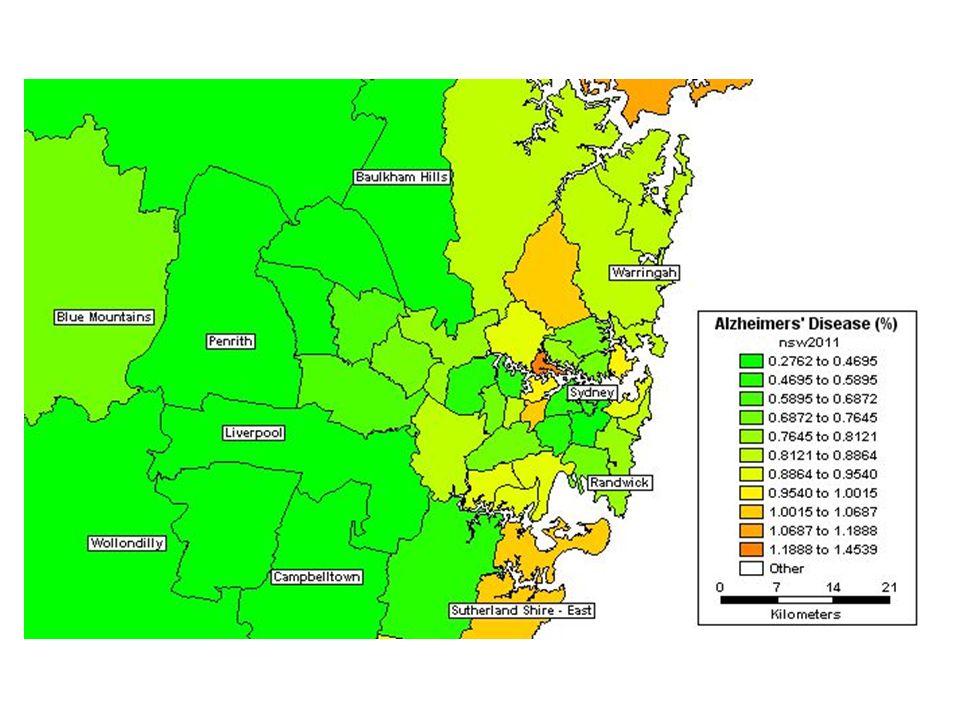
Sydney Metro Model Aged 85+ projected from 2001 out to 2031 using SLAs and SOPS Data

29
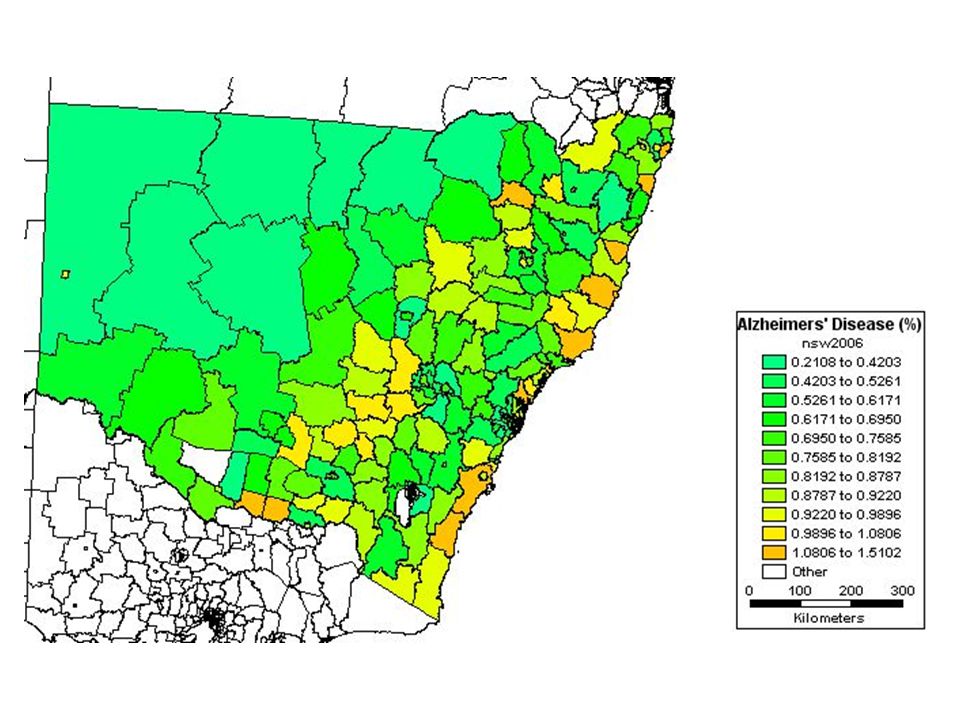
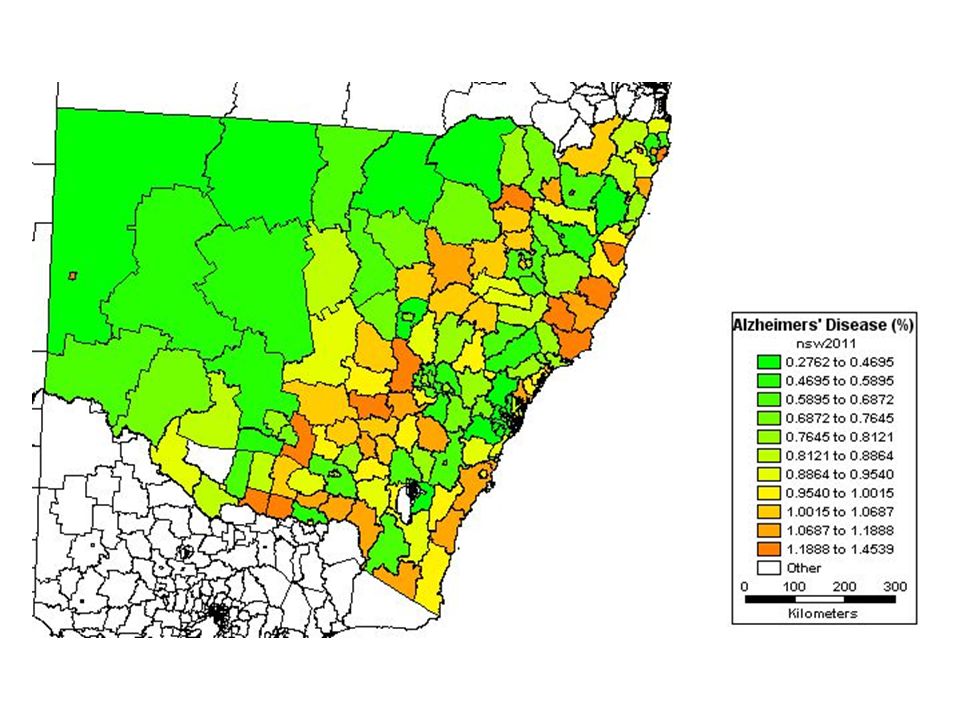
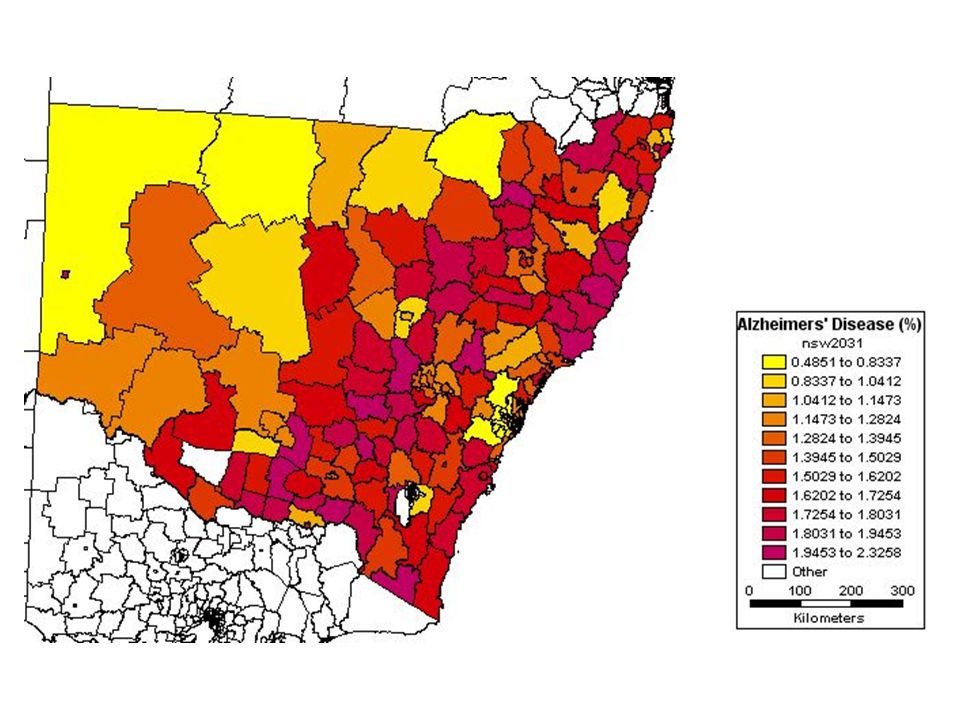
New South Wales Model

37
Conclusion GIS lends itself to better understanding of and planning for long term health issues Mapping lends flexibility to planning eg. model at various scales from nation down to neighbourhood Simplifies/clarifies the numbers approach for a broader audience

38
Where to Next? Plenty left to do to ensure model is relevant and accurate for users Complete conversion and analysis of all five waves of data (have Wave 1) Finalise our model of progression of neurodegenerative diseases over the ageing process Add service demands and met/unmet needs to model Make internet friendly for a wider audience
 Finalise our model of progression of neurodegenerative diseases over the ageing process Add service demands and met/unmet needs to model Make internet friendly for a wider audience.")
Similar presentations