Download presentation
Presentation is loading. Please wait.

1
NUCAPS Usage in Operational Forecasting
AMS Short Course: GOES-R and JPSS Preview for Users January 10, 2016 Daniel Nietfeld Science and Operations Officer (SOO) NOAA-NWS-WFO Omaha Deputy Team Lead for Product Readiness & Operations (PRO) NOAA/NESDIS/GOES-R
 NOAA-NWS-WFO Omaha. Deputy Team Lead for Product Readiness & Operations (PRO) NOAA/NESDIS/GOES-R.")
2
Hopeful Takeaways The Appeal of Hyperspectral Profile Retrievals (NUCAPS Soundings) Understanding of what these are (and aren’t) Issues for Forecasters to be aware of Possible uses Examples Software to obtain, display, modify, and compare

3
“Day in the Life” of a NWS Forecaster in the Midwest
Convection is a common forecast problem Thermodynamic environment is KEY Accustomed to looking at the 12Z RAOB, with density of ~ 2 per state

4
Upper Air RAOB Network

5
Day in the Life of a Forecaster in a Midwest WFO
Convection is a common forecast problem Thermodynamic environment is KEY Accustomed to looking at the 12Z RAOB, with density of ~ 2 per state During the pre-convective, early afternoon, I modify the 12Z RAOB for current surface conditions, and try to modify it for any changes in the airmass (from upstream)
")
6
Modified for 19Z changes in
T and Td CAPE: 460 J/KG CAPE: J/KG

7
19Z Profile Supported Development of 4 Violent Tornadoes

8
Day in the Life of a Forecaster in a Midwest WFO
18Z (or 19Z) Special RAOB is a luxury I don’t have to guess about the airmass changes I typically still need to tweak the surface conditions due to the sensitivity to dewpoint Only valid for the point of the RAOB We occasionally get an Aircraft observation I look at all of my data with some sense of the margin of error (and I try to learn what that margin of error is). Observations from instrumentation NWP
 Special RAOB is a luxury. I don’t have to guess about the airmass changes. I typically still need to tweak the surface conditions due to the sensitivity to dewpoint. Only valid for the point of the RAOB. We occasionally get an Aircraft observation. I look at all of my data with some sense of the margin of error (and I try to learn what that margin of error is). Observations from instrumentation. NWP.")
9
Imagine having thousands of 18-19Z soundings!!

10
Along Comes NUCAPS from the Suomi NPP Satellite
NOAA Unique CrIS ATMS Processing System Operational CrIS+ATMS physical retrieval algorithm NUCAPS vertical temperature and moisture profiles are available from NPP operationally Example NUCAPS Skew-T Profile in AWIPS-II NSHARP Observed Radiosondes Example NUCAPS Coverage Parcel LR Temperature Dew Point

11
Along Comes NUCAPS from the Suomi NPP Satellite
18-19 UTC! NOAA Unique CrIS ATMS Processing System Operational CrIS+ATMS physical retrieval algorithm NUCAPS vertical temperature and moisture profiles are available from NPP operationally Example NUCAPS Skew-T Profile in AWIPS-II NSHARP Observed Radiosondes Example NUCAPS Coverage Parcel LR Temperature Dew Point

12
4 consecutive passes over CONUS
This shows 4 consecutive passes. North of 40 N there's overlap from one pass to the next. But there are regions over the southern US -- small regions -- that are unsampled. Of course, these regions differ from day to day as the orbits shift eastward from one day to the next. 4 consecutive passes over CONUS overlap north of ~40N

13
NPP Polar Orbiting Global Coverage

14
NUCAPS NOAA Unique CrIS ATMS Processing System
CrIS: Cross-track Infrared Sounder (1305 channels) ATMS: Advanced Technology Microwave Sounder (22 channels) All instruments on Suomi/NPP East Coast: 05z/17z Plains: 07z/19z West Coast: 11z/23z Svalbard Downlink NSOF (NDE) NWS Gateway SBN CONUS Data Flow WFO
 ATMS: Advanced Technology Microwave Sounder (22 channels) All instruments on Suomi/NPP. East Coast: 05z/17z. Plains: 07z/19z. West Coast: 11z/23z. Svalbard. Downlink. NSOF. (NDE) NWS. Gateway. SBN. CONUS Data Flow. WFO.")
15
Which CrIS channels are used for physical retrieval step? 399 of them
24 for surface temperature 87 for atmospheric temperature 62 for water vapor Channels chosen most sensitive to one gas and least sensitive to other gases All ATMS channels (22 of them) are used in NUCAPS NUCAPS soundings are produced using a regression and a physical retrieval. The Regression step uses coefficients trained from cases that used all CrIS/ATMS data and ECMWF model output on select days in the past to find the best statistical relationship between the satellite data and the profiles of Temperature and moisture (“Best” being subject to the constraints of the weather on the test days, of course). That training yielded a set of static coefficients that are used with present-day regressions. Regressions with the data use *all channels*, so they capture more vertical structure than in the physical retrievals that uses a subset of CrIS channels. When a set of soundings is being produced, regression is done first with all NUCAPS data to get temperature and moisture profiles, these data are used to do cloud-clearing – more on that in a minute. Then the physical retrievals are done, sequentially. The physical retrieval is done using a subset of 399 of more than 1300 CrIS channels, shown on this chart. In the physical retrieval, the algorithm sequentially solves for temperature, moisture, ozone and other gases. The first guess for this is climatology: Think about what that means if you are in a regime that deviates significantly from normal. There are 24 channels (highlighted in green) from which surface temperature is retrieved, 62 (in red) from which water vapor is retrieved, etc. The channels selected are most sensitive to one gas while being less sensitive to other gases. That is, they have high (but not perfect) spectral purity. All 22 ATMS channels are used in NUCAPS. The ATMS retrieval is the solution if either the cloud clearing fails or if the CrIS Physical retrieval fails. Reference for how atmospheric data can be obtained from various wavelengths: COMET’s Module on “Advanced Satellite Sounding: The Benefits of Hyperspectral Observation - 2nd Edition”
 are used in NUCAPS. NUCAPS soundings are produced using a regression and a physical retrieval. The Regression step uses coefficients trained from cases that used all CrIS/ATMS data and ECMWF model output on select days in the past to find the best statistical relationship between the satellite data and the profiles of Temperature and moisture ( Best being subject to the constraints of the weather on the test days, of course). That training yielded a set of static coefficients that are used with present-day regressions. Regressions with the data use *all channels*, so they capture more vertical structure than in the physical retrievals that uses a subset of CrIS channels. When a set of soundings is being produced, regression is done first with all NUCAPS data to get temperature and moisture profiles, these data are used to do cloud-clearing – more on that in a minute. Then the physical retrievals are done, sequentially. The physical retrieval is done using a subset of. 399 of more than 1300 CrIS channels, shown on this chart. In the physical retrieval, the algorithm sequentially solves for temperature, moisture, ozone and other gases. The first guess for this is climatology: Think about what that means if you are in a regime that deviates significantly from normal. There are 24 channels (highlighted in green) from which surface temperature is retrieved, 62 (in red) from which water vapor is retrieved, etc. The channels selected are most sensitive to one gas while being less sensitive to other gases. That is, they have high (but not perfect) spectral purity. All 22 ATMS channels are used in NUCAPS. The ATMS retrieval is the solution if either the cloud clearing fails or if the CrIS Physical retrieval fails. Reference for how atmospheric data can be obtained from various wavelengths: COMET’s Module on Advanced Satellite Sounding: The Benefits of Hyperspectral Observation - 2nd Edition")
16
Effective vertical resolution
(Tropical Western Pacific) (Southern Great Plains) NUCAPS resolves about 9-10 vertical levels of water vapor, and about 20 layers of temperature, in the atmosphere. The charts show the averaging kernel functions for temperature and it shows how the effect of one CrIS spectrum might be spread out in the vertical. There is some geographic variability to the kernels. E.Maddy, IEEE 2008 NUCAPS resolves about 9-11 vertical levels of water vapor in the entire atmosphere NUCAPS resolves about 20 vertical levels of temperature in the entire atmosphere
 (Southern Great Plains) NUCAPS resolves about 9-10 vertical levels of water vapor, and about 20 layers of temperature, in the atmosphere. The charts show the averaging kernel functions for temperature and it shows how the effect of one CrIS spectrum might be spread out in the vertical. There is some geographic variability to the kernels. E.Maddy, IEEE NUCAPS resolves about 9-11 vertical levels of water vapor in the entire atmosphere. NUCAPS resolves about 20 vertical levels of temperature in the entire atmosphere.")
17
Summary of products from NUCAPS (and AWIPS-II)
gas Precision d.o.f. Interfering Parameters Sensitivity Temperature Profile, T(p), SST, LST 1.5K/km 6-10 Emissivity, H2O, O3, N2O surface to ~1 mb Water Profile, H2O(p) 15% 4-6 CH4, HNO3 surface to ~300 mb Cloud Top Pressure Cloud fraction 25 mbar, 1.5K, 5% 2 18 CO2, H2O surface to tropopause Ozone, O3 10% 1+ H2O, emissivity Lower stratosphere Carbon Monoxide, CO 1 H2O, N2O Mid-troposphere Methane, CH4 1.5% H2O, HNO3, N2O Carbon Dioxide, CO2 0.5% H2O, O3, T(p) Sulfur Dioxide, SO2 50% < 1 H2O, HNO3 Volcanic flag Nitric Acid, HNO3 emissivity H2O, CH4, N2O Upper troposphere Nitrous Oxide, N2O 5% H2O, CO This slide shows what is available from NUCAPS Soundings -- and what is in AWIPS II (in the red box). Think of Degrees of Freedom as something like layer resolution -- that is, there are approximately 6-10 layers of temperature resolved in the profile, and 4-6 layers of moisture. Do not expect to see very thin layers in a NUCAPS sounding. These degrees of freedom are valid for the Physical Retrieval that moves around/alters the Regression first guess. Chemical species in NUCAPS that aren't available in AWIPS can be accessed via NOAA's CLASS. O3 = Ozone, CO = Carbon Monoxide, CH4 = Methame CO2 = Carbon Dioxide, SO2 = Sulfur Dioxide, HNO3 = Nitric Acid N2O = Nitrous Oxide Ammonia = NH3 = 7.5*BT(867.75)/(BT(861.25)+BT(873.5)) mg/m^2 Clarisse, L., C. Clerbaux, F. Dentener, D. Hurtmans and P.F. Coheur Global ammonia distribution derived from infrared satellite observations. Nature Geoscience v.2 p IASI products: HNO3: -1.4 K/100% at 879, -1.17K/100% at N2O: -0.44H/5% at 1300, K/5% at CFCl3(F11): 0.08/10% at 847 CF2Cl(F12): 0.124/10% at 922 SO2: -0.2K/1000% at 1345,1371 cm-1 CCl4: K/10% at 795
, SST, LST. 1.5K/km Emissivity, H2O, O3, N2O. surface to ~1 mb. Water Profile, H2O(p) 15% 4-6. CH4, HNO3. surface to ~300 mb. Cloud Top Pressure. Cloud fraction. 25 mbar, 1.5K, 5% CO2, H2O. surface to tropopause. Ozone, O3. 10% 1+ H2O, emissivity. Lower stratosphere. Carbon Monoxide, CO. 1. H2O, N2O. Mid-troposphere. Methane, CH4. 1.5% H2O, HNO3, N2O. Carbon Dioxide, CO2. 0.5% H2O, O3, T(p) Sulfur Dioxide, SO2. 50% < 1. H2O, HNO3. Volcanic flag. Nitric Acid, HNO3. emissivity. H2O, CH4, N2O. Upper troposphere. Nitrous Oxide, N2O. 5% H2O, CO. This slide shows what is available from NUCAPS Soundings -- and what is in AWIPS II (in the red box). Think of Degrees of Freedom as something like layer resolution -- that is, there are approximately 6-10 layers of temperature resolved in the profile, and 4-6 layers of moisture. Do not expect to see very thin layers in a NUCAPS sounding. These degrees of freedom are valid for the Physical Retrieval that moves around/alters the Regression first guess. Chemical species in NUCAPS that aren t available in AWIPS can be accessed via NOAA s CLASS. O3 = Ozone, CO = Carbon Monoxide, CH4 = Methame. CO2 = Carbon Dioxide, SO2 = Sulfur Dioxide, HNO3 = Nitric Acid. N2O = Nitrous Oxide. Ammonia = NH3 = 7.5*BT(867.75)/(BT(861.25)+BT(873.5)) mg/m^2. Clarisse, L., C. Clerbaux, F. Dentener, D. Hurtmans and P.F. Coheur Global ammonia distribution derived from infrared satellite. observations. Nature Geoscience v.2 p IASI products: HNO3: -1.4 K/100% at 879, -1.17K/100% at N2O: -0.44H/5% at 1300, K/5% at CFCl3(F11): 0.08/10% at 847. CF2Cl(F12): 0.124/10% at 922. SO2: -0.2K/1000% at 1345,1371 cm-1. CCl4: K/10% at 795.")
18
Atmospheric Soundings from NUCAPS
Operational since 2013 Resolution over the entire atmosphere: 20-layer temperature resolution 9-11 layers water vapor resolution Best resolution in mid-troposphere First Guess : NCEP-based climatology and GFS Surface Pressure Generally, the best resolution is mid-tropospheric. The 1st guess is derived from climatology. A microwave-only retrieval will be done (for temperature and moisture only – no trace gases) if the physical retrieval using CrIS or if the cloud-clearing fails.
 if the physical retrieval using CrIS or if the cloud-clearing fails.")
19
How are Sounding Produced
Regression uses static coefficients derived from ECMWF output for selected focus days (used to create a first guess/cloud-clearing field that uses climatology). Regression (for cloud-clearing) uses all CrIS and ATMS channels Retrieval minimizes Observation-Calculation value If the environment really deviates from normal, the retrieval has a lot of work to do to converge to a solution. If this doesn’t converge to a solution, sounding is still produced, but flagged Retrieval uses a subset of channels Shape-preserving; adjusts regression to the solution Final Sounding is computed on 100 levels that are standard for a Radiative Transfer Model More levels than warranted by Sounder resolution You see these 100 levels in AWIPS 2 A physical retrieval is used to produce the sounding, minimizing the difference between observations and calculations. If the environment really deviates from normal, the retrieval has to do a lot of work to converge to a solution. If that convergence to a solution doesn't happen, the sounding is still produced, but flagged. What is OBS-CALC? The OBS Vector is a cloud-cleared radiance spectrum (using the subset of CrIS radiances). The CALC vector is from a radiative transfer model that uses the regression solution – trained with the ECMWF – and climatology. The final output is mapped to 100 levels that are standard for a radiative transfer model. You'll notice the 100 levels in AWIPS are always the same pressure surfaces. It's really more levels than are resolved.
. Regression (for cloud-clearing) uses all CrIS and ATMS channels. Retrieval minimizes Observation-Calculation value. If the environment really deviates from normal, the retrieval has a lot of work to do to converge to a solution. If this doesn’t converge to a solution, sounding is still produced, but flagged. Retrieval uses a subset of channels. Shape-preserving; adjusts regression to the solution. Final Sounding is computed on 100 levels that are standard for a Radiative Transfer Model. More levels than warranted by Sounder resolution. You see these 100 levels in AWIPS 2. A physical retrieval is used to produce the sounding, minimizing the difference between observations and calculations. If the environment really deviates from normal, the retrieval has to do a lot of work to converge to a solution. If that convergence to a solution doesn t happen, the sounding is still produced, but flagged. What is OBS-CALC The OBS Vector is a cloud-cleared radiance spectrum (using the subset of CrIS radiances). The CALC vector is from a radiative transfer model that uses the regression solution – trained with the ECMWF – and climatology. The final output is mapped to 100 levels that are standard for a radiative transfer model. You ll notice the 100 levels in AWIPS are always the same pressure surfaces. It s really more levels than are resolved.")
20
How do NUCAPS soundings appear?
NUCAPS Sounding Points overlain over a Visible Suomi NPP Image This shows the NUCAPS Sounding points plotted on top a VIIRS .64 micron image. Note that NUCAPS sounding data do not extend to the edge of the swath. Plotting soundings over data like this allows you to anticipate where soundings might have difficulties because of clouds.

21
NUCAPS Sounding Points overlain over a Visible Suomi NPP Image
4 Points to examine: NC in clear air We'll look at 4 different soundings. one in NC in clear air..

22
Clear Air, North Carolina
The sounding in clear air over North Carolina is smoothly varying as is typical for atmospheric soundings, with a well-mixed boundary layer Clear Air, North Carolina

23
NUCAPS Sounding Points overlain over a Visible Suomi NPP Image
4 Points to examine: NC in clear air NC near cloud edge KY is deep clouds One in deep clouds over Kentucky

24
The sounding in deep clouds probably failed to converge, and an error flag is available. AWIPS software is being modified so that you know the sounding is bad before you look at it. Soundings such as these that look non-physical are most common in regions of thick cloudiness, so use NUCAPS soundings with caution in such regions. That's a good reason to plot the sounding locations - the green dots -- over satellite information. Upper level information for this sounding -- such as the tropopause height -- may still be useful. Deep Clouds, Kentucky

25
Forecast Problem: 29 May 2014 Afternoon/Evening Convection ?
GFS 9 hour fcst From 12UTC 29 May Valid 21 UTC 29 May 1915 UTC Visible This is a more forecast-specific use of the soundings. Will that broken cumulus field on the border of Iowa/Nebraska develop? The GFS is predicting QPF later in the day. Will the Cumulus Field develop further? (As suggested by the GFS)
")
26
NUCAPS Soundings give thermodynamic information at a convenient time!
Suomi NPP overflies the central US around 18 or 19z; this provides timely information on the state of the atmosphere in early afternoon. Here we have three different scenes, zooming in from North America to the Plains to WFO Omaha. Let's look at the sounding in eastern Nebraska, circled in red. 1842 UTC NPP pass

27
NUCAPS Sounding 1842 UTC 29 May 2014 Would you expect convective development?
T = 79F (METAR = 80F) Td = 60F (METAR = 63F) CAPE ~ 50 J/KG This sounding has a surface temperature and dewpoint close to observations (so we needn't edit the sounding to bring it into accord with observations). CAPE is small. Would you expect convective development?
 Td = 60F (METAR = 63F) CAPE ~ 50 J/KG. This sounding has a surface temperature and dewpoint close to observations (so we needn t edit the sounding to bring it into accord with observations). CAPE is small. Would you expect convective development")
28
Late afternoon visible imagery shows that the cumulus field has dissipated.
2354 UTC Visible

29
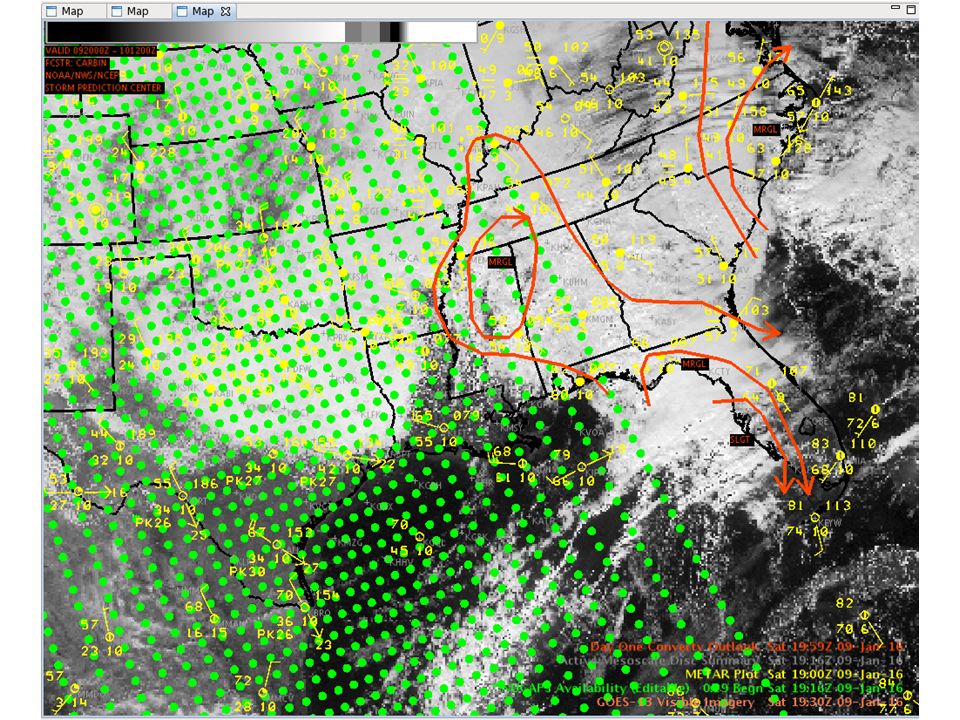
June 3, 2014 High Risk Severe Weather Event in Omaha
A couple days later, Omaha experienced severe weather. This image shows the storm reports, damage, and two NUCAPS sounding sites from 1849 UTC on 3 June. Note also the gradient in dewpoint in the plotted METARs. The next page shows the NUCAPS sounding for the site just south of the Omaha WFO -- the one in the Green Box.

30
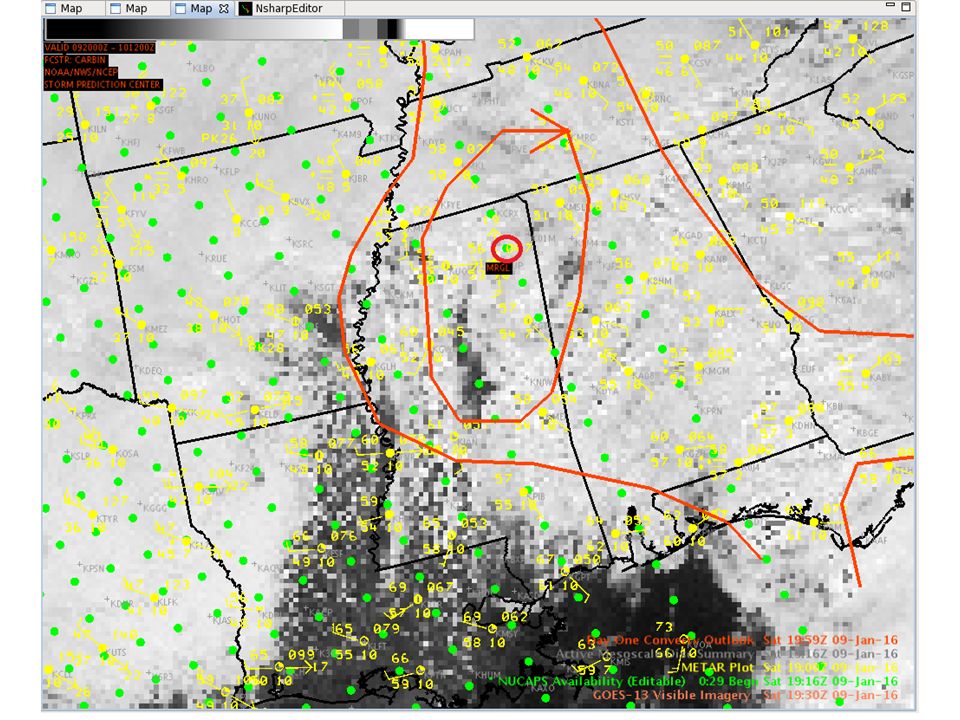
June 3, 2014 High Risk Severe Weather Event in Omaha
NUCAPS sounding locations Overlaid with VIIRS 0.64 1905Z June 3, 2014 Location of OAX in yellow Northern dot is within a few KM of KOAX, but under cloud cover Southern dot is in a nearly Cloud-free location, and is warmer and more humid OAX Zooming in again, we see the sounding from the cloudy region -- boxed in green, and also a second sounding to the south where skies are clearer. (And dewpoints are warmer there too)
")
31
June 3, 2014 High Risk Severe Weather Event in Omaha
NUCAPS ~10 KM south of OAX 1849Z June 3, 2014 – cloudy scene, but still gives info! Modified for surface METAR Ob of T=83, Td=63 SB CAPE = 1851 The NUCAPS sounding from the site in the green box on the previous page -- a cloudy region, but the sounding still gives information. This sounding has been modified so the surface METARs match the sounding values. Surface-based CAPE is 1851.

32
June 3, 2014 High Risk Severe Weather Event in Omaha
NUCAPS sounding locations overlain on VIIRS 0.64 1905Z June 3, 2014 The boxed site is the one we just looked at. Note that a clear Sounding is just south -- and recall that there is a strong dewpoint gradient in the region.

33
June 3, 2014 High Risk Severe Weather Event in Omaha
NUCAPS sounding 40 km south of OAX 1849Z June 3, 2014 Unmodified SB CAPE = 686 Here is the unmodified NUCAPS sounding at that southern site. Surface-based CAPE is around but the surface temperature/dewpoint in the sounding do not match the METARs. This is a good sounding to edit.

34
June 3, 2014 High Risk Severe Weather Event in Omaha
NUCAPS sounding 40 km south of OAX 1849Z June 3, 2014 Modified for surface METAR Ob of T=85, Td=68 SB CAPE = 3095 Once the sounding is edited so that its lowest temperature/dewpoint match the METAR, surface based CAPE exceeds 3000! This kind of information should influence your interpretation of present conditions.

35
Issue #1: Smoothing Vertical resolution is a bit course
~20 temperature layers ~10 moisture layers Significant smoothing Identification of warm capping layers? Identification of dry layers aloft (downburst potential)?
")
37
Issue #2: Surface/BL Modification
Modification is necessary 99+% of the time due to errors in surface T and Td Techniques, such as SPC’s SFCOA, have been used to objectively modifying the low levels of a sounding (RAP) using METARs Automation of Sounding Modification at the Surface and in the BL – ongoing project: “Improving NUCAPS Soundings for CONUS Severe Weather Applications via Data Fusion” - Dan Lindsey PI
 using METARs. Automation of Sounding Modification at the Surface and in the BL – ongoing project: Improving NUCAPS Soundings for CONUS Severe Weather Applications via Data Fusion - Dan Lindsey PI.")
38
Issue #3: Clouds/Rain Errors
Extra caution/scrutiny is needed Excited about the recent improvements!

39
Quality Control - Problems
Life isn’t always perfect in the world of satellite profile retrievals… Microwave or IR retrieval failures/errors Regression failures/errors

40
New color scheme based on QC Flag Status (in development on AWIPS2)
")
41
Why not use the NWP sounding?
Sometimes do, but subject to NWP issues/errors Soundings within model convection Convective Parameterization Schemes result in unrealistic profiles

42
Real vs. Modeled Observed GOES Visible HRRR 2-hr forecast 2 hr fcst
from 17Z run 1900 UTC June 16, 2015 Atmosphere with clear, blue sky 1900 UTC June 16, 2015 Atmosphere with deep convection

43
Cold Air Aloft Application – Impacts for Aviation
Dual-Regression Retrievals for March 200hPa

44
Formal Evaluation of NUCAPS in NOAA’s Hazardous Weather Testbed 2015 Spring Experiment
Norman, Oklahoma (OU/NOAA Facility) 5 NWS forecasters, 1 broadcaster per week (30 total; and PI’s) 5 weeks in May and June, 2015 “Can NUCAPS data provide unique value to the severe weather nowcast and warning process?”
 5 NWS forecasters, 1 broadcaster per week (30 total; and PI’s) 5 weeks in May and June, Can NUCAPS data provide unique value to the severe weather nowcast and warning process")
45
NUCAPS in 2015 HWT Timing of profiles Most common uses in HWT
East: ~ Central: ~ Z West: Z Most common uses in HWT Analysis of pre-convective environment Asses instability, boundaries, etc Analysis of near-storm environment Comparisons with NWP, RAOBS Plus ~75 minute latency to AWIPS-II Sfc/near-surface modifications to profiles necessary in most cases Clear-sky selections recommended In general, forecasters felt that, when modified, the profiles provide an adequate and useful representation of the current state of the atmosphere … … leading them to see the value in having this information to fill the spatiotemporal gaps that exist in observed sounding information.

46
Blog Post: “NUCAPS Sample” May 12 - Pocatello, ID
“The instability seems a little high, but it could be localized. Will see how the thunderstorms in the area develop over the next few hours….. “ “This thunderstorm moved over the sampled area about two hours later. It peaked at about dBZ Composite Refl ” “With our office between ROAB sites, having the NUCAPS soundings will be a good way for us to get a handle on the conditions in our area.”

47
Blog Post: “NUCAPS Sample” May 13 - Midland, TX
Modifed NUCAPS Soundings Storms moving east into this environment continued to develop and strengthen Back west, no new development in environment characterized by weaker instability and less moisture “I liked it and thought it was useful to have today. My office is in between RAOB sites, so it would be nice to have this additional environmental information.”

48
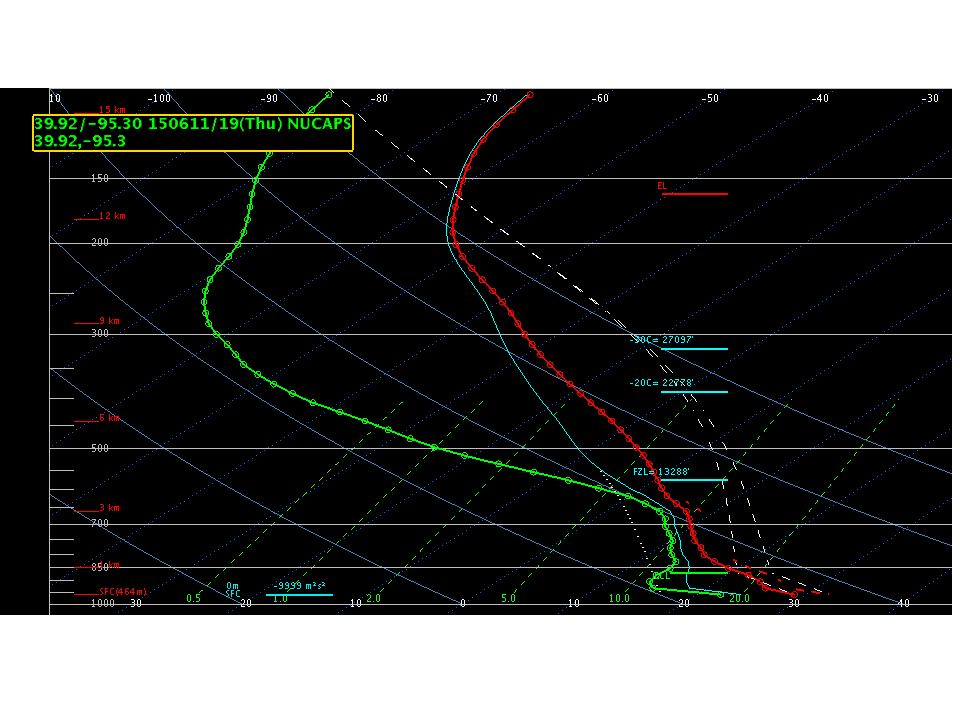
Blog Post: “West Texas Soundings” May 19 – Midland, TX
00Z MAF RAOB 12Z MAF RAOB 19Z NUCAPS near MAF “The drying of the air at mb since 12Z is reflected by intermediate NUCAPS soundings.” “The NUCAPS soundings are a good way to see changes in the airmass since the RAOB soundings have been taken.”

49
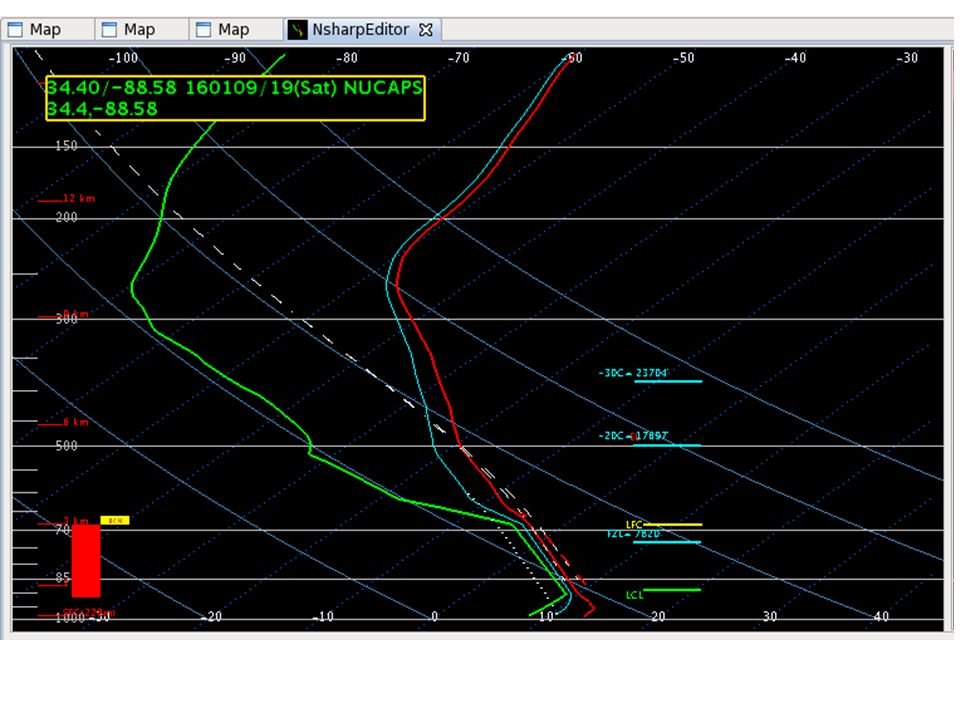
Blog Post: “NUCAPS compared to Observed IAD sounding” June 8 - Sterling, VA
“18 UTC NUCAPS sounding near IAD, modified for IAD surface data showing 2200 J/kg when compared to 900 J/kg in the observed IAD 18 UTC sounding. The observed sounding also shows an elevated mixed layer and capping near 825 mb which is not seen in the NUCAPS sounding. Observed 18z RAOB “I'm still a little suspect of the NUCAPS data as it doesn't show the fine scale detail that is so valuable in a standard RAOB.” NUCAPS “Fusing of all the sources is really the way to go, they should all be blended together, instead of having to use them all (NWP, NUCAPS, etc)”
")
50
NUCAPS Feedback All participants answered that they understand the differences between space-based soundings and RAOBs Only 1 NWS participant already uses NUCAPS at home office (Alaska) 20/23 say they will 5% 28% 74% 28% Daily Survey Q 26% Daily Survey Q 30% 8%
 20/23 say they will. 5% 28% 74% 28% Daily Survey Q. 26% Daily Survey Q. 30% 8%")
51
NUCAPS Feedback General shape and stability/moisture parameter values seemed realistic Comparable to observed soundings Important features and details such as capping inversions not depicted well (or at all) in the soundings Stable layer sometimes apparent (bump); how to interpret this was unknown Surface/ML modification often necessary, too cumbersome “Automating the modifications would be great, including the low-level mixing” QC Flags a must “QC flags would give me more confidence in the soundings, as it is difficult to judge with just the cloud data.” Various AWIPS-II requests Training requests More severe app examples Verification statistics
 in the soundings. Stable layer sometimes apparent (bump); how to interpret this was unknown. Surface/ML modification often necessary, too cumbersome. Automating the modifications would be great, including the low-level mixing QC Flags a must. QC flags would give me more confidence in the soundings, as it is difficult to judge with just the cloud data. Various AWIPS-II requests. Training requests. More severe app examples. Verification statistics.")
52
Future of NUCAPS in the HWT
2016 Spring Experiment Code upgrade Additional satellites QC flags Additional visualization options 2017 Spring Experiment Evaluate automated sfc modification NUCAPS project

53
Summary Produced with every Polar Orbiter pass, time latency is about minutes Afternoon Soundings: 16z on East Coast 18z in mid-continent 20-21z along West Coast Morning Soundings 07z on East Coast 09z in mid-Continent 11z along West Coast ~10 moisture layers and 20 temperature layers in the vertical Familiarize yourself with what information the soundings can yield Learn how to modify the soundings if the lowest layers don’t agree with nearby METARs A mix of infrared and microwave information. Regression can fail, but a sounding will still be produced. Ongoing work to add status flag to AWIPS 2 display. A summary of this training is on this slide. This concludes the training on NUCAPS sounding data in AWIPS 2.

54
Summary Best uses in clear air or scattered – broken clouds
Convection Cold air aloft Less useful in precipitation and thick, uniform cloud cover Not useful for determining precipitation type in winter weather Be aware of QC errors and unrealistic profiles

55
How can I utilize these “soundings” ??
Improvements in this area are coming… but try these: SHARPpy: RAOB: NPROVS: (NPROVS best for archives and comparisons, not real time) free commercial – not free free
 free. commercial – not free. free.")
56
Obtaining the Data Data available via NOAAPORT CLASS (data site):
Obtaining NUCAPS data from CLASS:

57
Web Links to Learn More NUCAPS full technical description: Hazardous Weather Testbed NUCAPS Blog: NPROVS comparison software:

58
Web Links to Learn More COMET’s Module on “Advanced Satellite Sounding: The Benefits of Hyperspectral Observation - 2nd Edition” NUCAPS Training Developed for NWS:

Similar presentations


 J. Kelly, Jr. National Weather Service Infusion of Satellite.>")


 Regional And Mesoscale Meteorology Branch (RAMMB)>")

 Suomi-NPP Workshop June 21, 2012 Washington, D.C. National Aeronautics.>")

 (Low Cloud/Fog, GeoColor, and UWCI) Daniel Nietfeld Science and Operations Officer (SOO)>")
 Product Training Session for Alaska Huan Meng, Ralph Ferraro, Brad Zavodsky NOAA/NESDIS NASA/SPoRT October 3, 2014.>")
