Download presentation
Presentation is loading. Please wait.

1
Public Health, Transportation, and the Built Environment: Benefits and Costs Marlon G. Boarnet Professor and Chair, Department of Planning, Policy, and Design UC Irvine

2
Benefits and Costs of Health, Travel, and Built Environment An Odd Question: 1.Are there specific well understood policy choices with quantified costs and benefits to analyze? 2.Is this a common question in earlier land use – transportation literature or practice? 3.Are there data that allow quantifying health benefits?

3
Background: Health, Land Use, and Travel Behavior Motivation: Obesity and Sedentary Activity 400,000 deaths per year in U.S. due to diseases linked to physical inactivity or diet 435,000 deaths per year in U.S. due to smoking

4
Obesity Trends* Among U.S. Adults BRFSS, 1988 No Data <10% 10%–14% (*BMI ≥30, or ~ 30 lbs overweight for 5’ 4” person)
.")
5
Obesity Trends* Among U.S. Adults BRFSS, 1989 No Data <10% 10%–14% (*BMI ≥30, or ~ 30 lbs overweight for 5’ 4” person)
.")
6
Obesity Trends* Among U.S. Adults BRFSS, 1990 No Data <10% 10%–14% (*BMI ≥30, or ~ 30 lbs overweight for 5’ 4” person)
.")
7
Obesity Trends* Among U.S. Adults BRFSS, 1991 No Data <10% 10%–14% 15%–19% (*BMI ≥30, or ~ 30 lbs overweight for 5’ 4” person)
.")
8
Obesity Trends* Among U.S. Adults BRFSS, 1992 No Data <10% 10%–14% 15%–19% (*BMI ≥30, or ~ 30 lbs overweight for 5’ 4” person)
.")
9
Obesity Trends* Among U.S. Adults BRFSS, 1993 No Data <10% 10%–14% 15%–19% (*BMI ≥30, or ~ 30 lbs overweight for 5’ 4” person)
.")
10
Obesity Trends* Among U.S. Adults BRFSS, 1994 No Data <10% 10%–14% 15%–19% (*BMI ≥30, or ~ 30 lbs overweight for 5’ 4” person)
.")
11
Obesity Trends* Among U.S. Adults BRFSS, 1995 No Data <10% 10%–14% 15%–19% (*BMI ≥30, or ~ 30 lbs overweight for 5’ 4” person)
.")
12
Obesity Trends* Among U.S. Adults BRFSS, 1996 No Data <10% 10%–14% 15%–19% (*BMI ≥30, or ~ 30 lbs overweight for 5’ 4” person)
.")
13
Obesity Trends* Among U.S. Adults BRFSS, 1997 No Data <10% 10%–14% 15%–19% ≥20 (*BMI ≥30, or ~ 30 lbs overweight for 5’ 4” person)
.")
14
Obesity Trends* Among U.S. Adults BRFSS, 1998 No Data <10% 10%–14% 15%–19% ≥20 (*BMI ≥30, or ~ 30 lbs overweight for 5’ 4” person)
.")
15
Obesity Trends* Among U.S. Adults BRFSS, 1999 No Data <10% 10%–14% 15%–19% ≥20 (*BMI ≥30, or ~ 30 lbs overweight for 5’ 4” person)
.")
16
Obesity Trends* Among U.S. Adults BRFSS, 2000 No Data <10% 10%–14% 15%–19% ≥20 (*BMI ≥30, or ~ 30 lbs overweight for 5’ 4” person)
.")
17
Obesity Trends* Among U.S. Adults BRFSS, 2001 No Data <10% 10%–14% 15%–19% 20%–24% ≥25% (*BMI ≥30, or ~ 30 lbs overweight for 5’ 4” person)
.")
18
(*BMI 30, or ~ 30 lbs overweight for 5’4” person) No Data <10% 10%–14% 15%–19% 20%–24% ≥25% (*BMI ≥30, or ~ 30 lbs overweight for 5’ 4” person) Obesity Trends* Among U.S. Adults BRFSS, 2002

19
Obesity* Trends Among U.S. Adults BRFSS, 2003 (*BMI ≥30, or ~ 30 lbs overweight for 5’ 4” person) No Data <10% 10%–14% 15%–19% 20%–24% ≥25%
 No Data <10% 10%–14% 15%–19% 20%–24% ≥25%.")
20
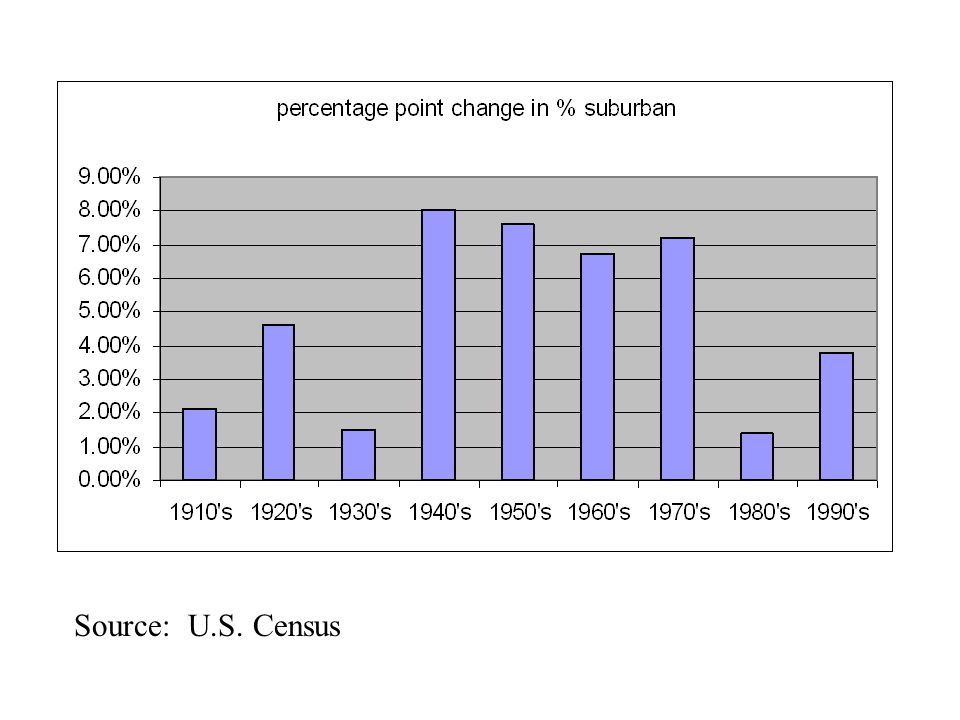
Do the Suburbs Make you Fat? Obesity epidemic occurred in the last generation Percent of U.S. Adult Population Obese: Late 1970’s: 15% 1999, 27% Source: U.S. Dept. of Health and Human Services Peak Suburban Growth from late 1940’s through 1970’s

21
Source: U.S. Census

25
Land Use, Travel, and Health Is land use planning part of the problem? Food processing, food availability, diet, lifestyle Can land use planning be part of the solution? Among 8,042 persons, 1,949 (24%) had at least one walking trip during two-day period. Median distance of a walk trip = 0.54 miles 25% of walking trips < 0.31 miles 25% of walking trips > 0.97 miles
 had at least one walking trip during two-day period. Median distance of a walk trip = 0.54 miles 25% of walking trips < 0.31 miles 25% of walking trips > 0.97 miles.")
26
Costs and Benefits of Land Use, Travel, and Health Large benefits for a few people Mobility: small benefits for large numbers of persons Move 100 persons from 16 to 48 minutes of PA per year discounted benefits = $5.2 to $15.86 million Projects can be inexpensive

27
California Safe Routes to School Authorized by California AB 1475, 1999 Renewed by SB10, 2001 As of Fall, 2003, 3 cycles of projects funded –Over 270 projects funded –$66 million in federal funds allocated State match capped at $250,000 per project

28
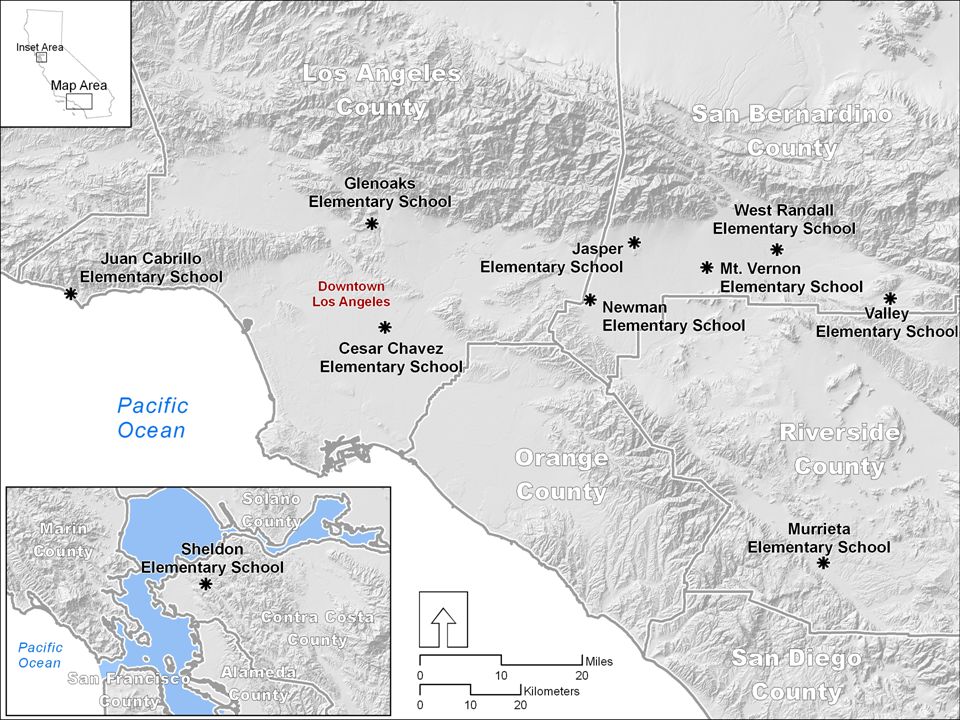
Safe Routes to School Evaluation 10 elementary school sites studied Before/After evaluation –Traffic characteristics Vehicle counts, vehicle speed, yield to non- motorized traffic, walk/bicycling counts and on sidewalk/street –Urban Design –Survey of parents of 3 rd -5 th grade children Did child walk more after SR2S construction?

30
Sort by Whether SR2S Project Along Route to School Survey asked if project was along child’s usual route to school 52% of parents said “yes”; 48% said “no” Star indicates location of elementary school; Circle represents portion of neighborhood included in the study (approx. ¼ mile radius from the elementary school)
.")
31
After Construction Data 1244 returned “after construction” surveys from 10 schools School response rates varied from 23% to 54% Full Sample Response Rate: 40%

32
Results, by School % Walk More Diff t- statisticn Along RouteNot Along Route Cesar Chavez20.59%6.15%14.43%2.52151 Glenoaks12.00%7.69%4.31%0.76126 Jasper3.13%0.00%3.13%1.0257 Juan Cabrillo6.67%0.00%6.67%1.0432 Mt. Vernon19.05%5.71%13.33%1.8587 Murrietta13.73%2.38%11.34%2.12101 Newman10.94%0.00%10.94%2.80101 Sheldon15.63%0.00%15.63%2.4362 Valley11.59%0.00%11.59%3.0197 West Randall28.57%7.41%21.16%3.15139

33
SR2S on Planning’s Terms Small (approx. $250,000) projects can increase the likelihood of children walking to school Physical activity may increase But these projects were sound planning anyways – the health link can allow us to better understand planning
 projects can increase the likelihood of children walking to school Physical activity may increase But these projects were sound planning anyways – the health link can allow us to better understand planning.")
34
Sidewalk Gap Closure Results School# Walk Before # Walk After % on Street Before % on Street After T-stat Sheldon13815266%35%5.55 Valley648942%4%6.79 West Randall 692114675%5%39.23

35
Sheldon Elementary: Average Vehicle Speeds on San Pablo Dam Road

36
Sheldon: Safety Advantage from Shift of Walking to Sidewalk San Pablo Dam Road after sidewalk improvement San Pablo Dam Road before sidewalk improvement

37
Other Results Frank, et al. study of walking in Seattle neighborhoods 8.8 additional minutes of walking associated with: –Increase from 52.28 to 62.74 intersections per square kilometer –Increase residential density from 3.63 to 4.36 du per acre –Increase in the mixed use index from 0.31 to 0.37 –Increase in retail floor area ratio from 0.25 to 0.30

38
Montara Elementary School, South Gate, approximately 66 intersections per sq. km.

39
Back Bay, Newport Beach/Costa Mesa, approximately 47 intersections per sq. km.

40
West Los Angeles, approximately 70 intersections per sq. km.

41
Conclusion Changes associated with increased walking are within range of development experience Low-cost projects can have impacts Basic infrastructure – sidewalks, street crossings, public spaces Elements of neighborhood design

Similar presentations


![HEALTHY COMMUNITY DESIGN Planning and designing communities that make it easier for people to live healthy lives [presenter name/title here/affiliation]](/8/2309633/big_thumb.jpg "HEALTHY COMMUNITY DESIGN Planning and designing communities that make it easier for people to live healthy lives [presenter name/title here/affiliation]>")


![[Jurisdiction’s] Draft Complete Streets Policy Resolution](/14/4278254/big_thumb.jpg "[Jurisdiction’s] Draft Complete Streets Policy Resolution>")


