Download presentation
Presentation is loading. Please wait.

1
CPC Monthly Climate Review July 2014 Yan Xue Outline: 1.Global Patterns 2.Tropical Climate Variability ENSO, MJO, IOD, TAV, Hurricane Season 3.Extra-Tropical Climate Variability 4.U.S. Climate, Outlooks and Verifications Thanks to Anthony Artusa, Wanqiu Wang, Pingping Xie, Caihong Wen, Michelle L’Heureux, Jon Gottschalck, Wei Shi, Scott Weaver, Randy Schechter

2
1. Global Patterns

3
SST Anomaly ( 0 C) and Anomaly Tendency http://www.cpc.ncep.noaa.gov/products/GODAS/ocean_briefing.shtml
 and Anomaly Tendency")
4
Upper 300m Heat Content Anomaly ( 0 C) and Anomaly Tendency http://www.cpc.ncep.noaa.gov/products/GODAS/multiora_body.html
 and Anomaly Tendency")
5
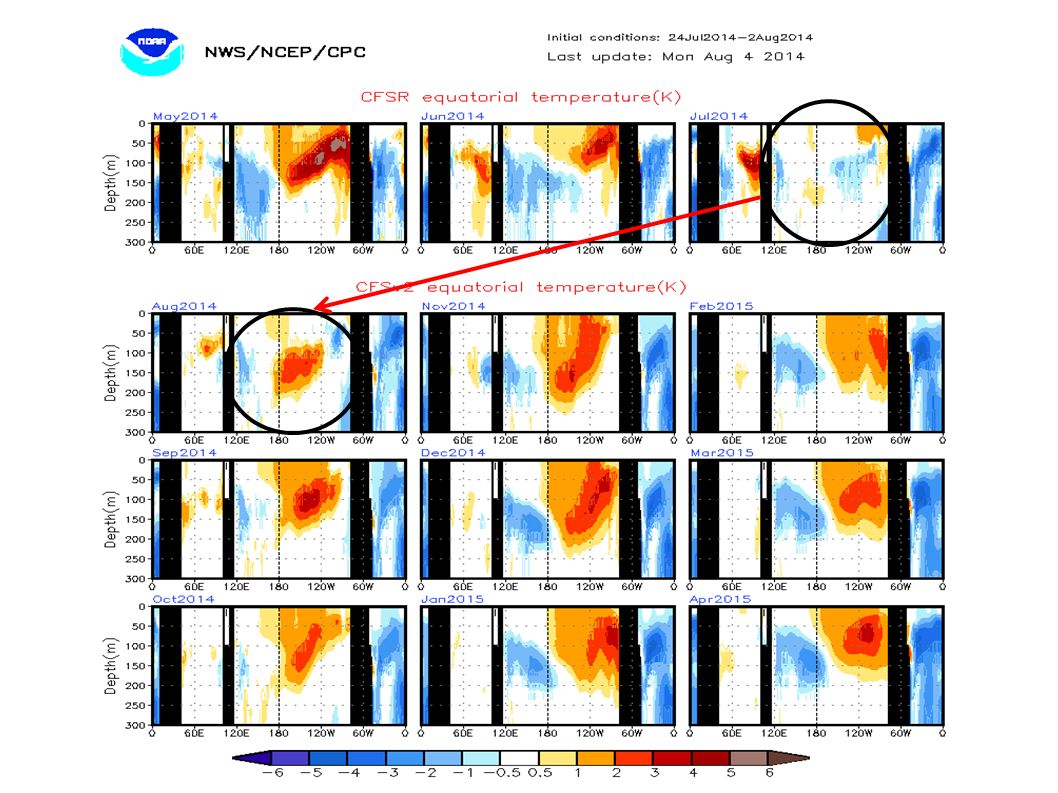
Longitude-Depth Temperature Anomaly and Anomaly Tendency in 1 O S-1 O N http://www.cpc.ncep.noaa.gov/products/GODAS/multiora_body.html

6
Sea Surface Salinity (SSS) and E-P Anomaly From Pingping Xie
 and E-P Anomaly From Pingping Xie")
7
SST Indices

8
SOI < 0: El Nino-Like SOI > 0: La Nina-Like OLR < 0: El Nino-Like OLR > 0: La Nina-Like u850 < 0: El Nino favorable u850 > 0: La Nina favorable SOI, Winds and OLR Indices

9
La Nina-Like SLP in 5S-5N

10
Neutral (May-Jul) U850 in 5S-5N La Nina-Like El Nino-Like (Jan-Apr)
 U850 in 5S-5N La Nina-Like El Nino-Like (Jan-Apr)")
11
La Nina-Like OLR in 5S-5N El Nino-Like since Mar 2014

12
ENSO, MJO, IOD, TAV, Hurriance 2. Tropical Climate Variability

13
Weekly ENSO Update http://www.cpc.ncep.noaa.gov/products/pr ecip/CWlink/MJO/enso.shtml

14
Depth of 20C Isotherm Anomaly (2S-2N, GODAS) 850mb Zonal Wind Anomaly (5S-5N, NCEP R1)
 850mb Zonal Wind Anomaly (5S-5N, NCEP R1)")
16
Tropical Pacific Ocean Observing System Implemented last week http://www.cpc.ncep.noaa.gov/products/GODAS/multiora_body.html

17
Real-Time Multiple Ocean Reanalysis Intercomparison -The signal (ensemble mean) to noise (ensemble spread) ratio is relatively small in the western Pacific where negative anomalies dominated near the thermocline and in the eastern Pacific where negative anomalies dominated at depths of 75-150m. The small signal-to-noise ratio is partially related to sparse observations. GODAS http://www.cpc.ncep.noaa.gov/products/GODAS/multiora_body.html 1981-2010 Clim

18
Upper 300m Heat Content Anomaly (1981-2010 Clim.) - Positive heat content anomaly presented on equator near Dateline and off-equator along 7S and 5N. - Negative heat content anomaly was observed along the equator between 150W-120W, and in the northwest Pacific along 5N, which are unfavorable for El Nino development.

19
Warm Water Volume Index Derived From Ensemble Mean of Ocean Reanalyses JJ 82 JJ 97 JJ 14 Jul 2014 Jul 1997 (DJF NINO3.4=+2.2) Jul 1982 (DJF NINO3.4=+2.2) Jul 1991 (DJF NINO3.4=+1.6) Jul 2009 (DJF NINO3.4=+1.6) Jul 2006 (DJF NINO3.4=+0.7) Jul 2002 (DJF NINO3.4=+1.1) JJ 02 JJ 91 JJ 06 JJ 09 - Warm Water Volume averaged in Jun-Jul 2014 is weaker than that in Jun-Jul of 2009, 2006 and 1991 and is similar to that of Jun-Jul 2002.
 Jul 1982 (DJF NINO3.4=+2.2) Jul 1991 (DJF NINO3.4=+1.6) Jul 2009 (DJF NINO3.4=+1.6) Jul 2006 (DJF NINO3.4=+0.7) Jul 2002 (DJF NINO3.4=+1.1) JJ 02 JJ 91 JJ 06 JJ 09 - Warm Water Volume averaged in Jun-Jul 2014 is weaker than that in Jun-Jul of 2009, 2006 and 1991 and is similar to that of Jun-Jul 2002.")
20
1S-1N 5S-5N Jul 2014 Jul 2009 Jul 2006 Jul 2002

21
NINO3.4 Forecast Plums

22
22 From Wanqiu Wang

23
23 From Wanqiu Wang

27
850-hPa Vector Wind Anomalies (m s -1 ) Note that shading denotes the zonal wind anomaly Blue shades: Easterly anomalies Red shades: Westerly anomalies Easterly anomalies diminished over the central Indian Ocean. Westerly anomalies developed near the Date Line and across the Central Pacific. Westerly anomalies diminished over the Maritime Continent and intensified over the western North Pacific.

28
OLR Anomalies – Past 30 days Drier-than-normal conditions, positive OLR anomalies (yellow/red shading) Wetter-than-normal conditions, negative OLR anomalies (blue shading) During late June and early July, enhanced (suppressed) convection was observed over both the western and eastern Pacific (northern Indian Ocean and parts of Southeast Asia). During early to mid-July, enhanced convection developed over the Maritime Continent and central Pacific. The North American Monsoon remained enhanced, while suppressed convection was observed across the eastern Pacific and Central America Areas of enhanced convection were observed over India, Southeast Asia, the western Pacific, and the central Pacific during mid-July while suppressed convection intensified across the equatorial Indian Ocean.

29
Outgoing Longwave Radiation (OLR) Anomalies (2.5°N-17.5°N) Drier-than-normal conditions, positive OLR anomalies (yellow/red shading) Wetter-than-normal conditions, negative OLR anomalies (blue shading) (Courtesy of CAWCR Australia Bureau of Meteorology) Time Longitude Since January, enhanced convection has propagated slowly eastward from the Maritime Continent to the central Pacific (red box), interrupted periodically by subseasonal variability. The MJO became more coherent during April, with the subseasonal envelopes of enhanced and suppressed convection modulating the strength of the low frequency signal. The anomalous tropical convection pattern became largely incoherent during mid-May, with enhanced convection more clear over the eastern Pacific (red box). During June, the MJO became more organized, primarily over the Indian Ocean, but during July and into early August the pattern has become less coherent.
. During June, the MJO became more organized, primarily over the Indian Ocean, but during July and into early August the pattern has become less coherent..")
30
Evolution of Indian Ocean SST Indices Fig. I1a. Indian Ocean Dipole region indices, calculated as the area-averaged monthly mean sea surface temperature anomalies ( O C) for the SETIO [90ºE-110ºE, 10ºS-0] and WTIO [50ºE-70ºE, 10ºS-10ºN] regions, and Dipole Mode Index, defined as differences between WTIO and SETIO. Data are derived from the NCEP OI SST analysis, and anomalies are departures from the 1981-2010 base period means.
 for the SETIO [90ºE-110ºE, 10ºS-0] and WTIO [50ºE-70ºE, 10ºS-10ºN] regions, and Dipole Mode Index, defined as differences between WTIO and SETIO. Data are derived from the NCEP OI SST analysis, and anomalies are departures from the base period means..")
31
Evolution of Tropical Atlantic SST Indices Fig. A1a. Tropical Atlantic Variability region indices, calculated as the area-averaged monthly mean sea surface temperature anomalies (ºC) for the TNA [60ºW-30ºW, 5ºN-20ºN], TSA [30ºW-10ºE, 20ºS-0] and ATL3 [20ºW-0, 2.5ºS-2.5ºN] regions, and Meridional Gradient Index, defined as differences between TNA and TSA. Data are derived from the NCEP OI SST analysis, and anomalies are departures from the 1981-2010 base period means.
 for the TNA [60ºW-30ºW, 5ºN-20ºN], TSA [30ºW-10ºE, 20ºS-0] and ATL3 [20ºW-0, 2.5ºS-2.5ºN] regions, and Meridional Gradient Index, defined as differences between TNA and TSA. Data are derived from the NCEP OI SST analysis, and anomalies are departures from the base period means..")
32
http://www.cpc.ncep.noaa.gov/products/outlooks/hurricane2014/May/hurricane.shtml

33
2014 Hurricane Counts (http://weather.unisys.com/hurricane) - Atlantic Outlook: 8-13 Named Storms (12 average) 3-6 Hurricanes (6 average) 1-2 Major Hurricanes (3 average) - Atlantic Counts by Aug 4: 0 Named Storms 2 Hurricanes 0 Major Hurricanes - E. Pacific Outlook: 14-20 Named Storms (15 average) 7-11 Hurricanes (8 average) 3-6 Major Hurricanes (4 average) - E. Pacific Counts by Aug 4: 7 Named Storms 1 Hurricanes 3 Major Hurricanes
 7-11 Hurricanes (8 average) 3-6 Major Hurricanes (4 average) - E. Pacific Counts by Aug 4: 7 Named Storms 1 Hurricanes 3 Major Hurricanes.")
34
3. Extra-Tropical Climate Variability

35
PDO index - Pacific Decadal Oscillation is defined as the 1 st EOF of monthly ERSST v3b in the North Pacific for the period 1900- 1993. PDO index is the standardized projection of the monthly SST anomalies onto the 1st EOF pattern. - The PDO index differs slightly from that of JISAO, which uses a blend of UKMET and OIv1 and OIv2 SST.

36
NAO Index and SST Anomaly in North Atlantic Fig. NA2. Monthly standardized NAO index (top) derived from monthly standardized 500-mb height anomalies obtained from the NCEP CDAS in 20ºN-90ºN (http://www.cpc.ncep.noaa.gov). Time-Latitude section of SST anomalies averaged between 80ºW and 20ºW (bottom). SST are derived from the NCEP OI SST analysis, and anomalies are departures from the 1981-2010 base period means.
 derived from monthly standardized 500-mb height anomalies obtained from the NCEP CDAS in 20ºN-90ºN ( Time-Latitude section of SST anomalies averaged between 80ºW and 20ºW (bottom). SST are derived from the NCEP OI SST analysis, and anomalies are departures from the base period means..")
37
https://nsidc.org/arcticseaicenews/ Sea Ice Arctic Antarctic

38
Global Temperatures

39
Global Precipitation

40
4. U.S. Climate, Outlooks and Verifications

41
Atmospheric anomalies over the North Pacific & North America During the Last 60 Days 1 of 3 Since early June, an anomalous trough over the central and eastern U.S. has contributed to below-average temperatures in the region.

42
U.S. Temperature and Precipitation Departures During the Last 30 Days End Date: 2 August 2014 Percent of Average Precipitation Temperature Departures (degree C) 1 of 2
 1 of 2.")
43
U.S. Temperature and Precipitation Departures During the Last 90 Days End Date: 2 August 2014 Percent of Average Precipitation Temperature Departures (degree C) 2 of 2
 2 of 2.")
44
DROUGHT MONITOR SLSLSLSSSLLLSLSLSLSSSSLSSSSSSSSSSSLSLSLSLSSLLSLSLSLSSSSLSSSSSSSSSSSSSL TheDroughtMonitorfocusesonbroad-scaleconditions.Localconditionsmayvary.Seeaccompanyingtextsummaryforforecaststatements. L http://droughtmonitor.unl.edu/ U.S.DroughtMonitor July29,2014 Valid8a.m.EDT(ReleasedThursday,Jul.31,2014)Intensity: D0AbnormallyDryD1ModerateDroughtD2SevereDroughtD3ExtremeDroughtD4ExceptionalDrought Author:BradRippeyDroughtImpactTypes: S=Short-Term,typicallylessthan6months(e.g.agriculture,grasslands)L=Long-Term,typicallygreaterthan6months(e.g.hydrology,ecology)Delineatesdominantimpacts U.S.DepartmentofAgricultur e -Drought conditions worsened in northern California -Given the 3-year duration of the drought, California’s topsoil moisture (80% very short to short) and subsoil moisture (85%) reserves are nearly depleted. -The destructive Sand fire, north of Plymouth, California, burned more than 4,000 acres. -The first statewide curbs on water use since the current drought began nearly three years ago, implemented on July 29, can lead to fines of up to $500 per day for using a hose to clean a sidewalk or excessively watering their lawns.
Intensity: D0AbnormallyDryD1ModerateDroughtD2SevereDroughtD3ExtremeDroughtD4ExceptionalDrought Author:BradRippeyDroughtImpactTypes: S=Short-Term,typicallylessthan6months(e.g.agriculture,grasslands)L=Long-Term,typicallygreaterthan6months(e.g.hydrology,ecology)Delineatesdominantimpacts U.S.DepartmentofAgricultur e -Drought conditions worsened in northern California -Given the 3-year duration of the drought, California’s topsoil moisture (80% very short to short) and subsoil moisture (85%) reserves are nearly depleted. -The destructive Sand fire, north of Plymouth, California, burned more than 4,000 acres. -The first statewide curbs on water use since the current drought began nearly three years ago, implemented on July 29, can lead to fines of up to $500 per day for using a hose to clean a sidewalk or excessively watering their lawns..")
45
AUG TEMPAUG PRCP

51
Thanks!

52
Difference between GODAS and CFSR - The subsurface temperature anomaly in CFSR and GODAS is largely consistent except the cold anomaly at depths of 75-150m near 150W-120W was stronger in GODAS than in CFSR, which is consistent with the comparison with other ocean reanalyses in the previous slide.

53
Global SSH Anomaly & Anomaly Tendency

Similar presentations


>")


