Download presentation
Presentation is loading. Please wait.

1
An analysis of the evolution of the EMU and its future

2
1973 – UK, Demark and Ireland join EC. Norway rejects membership in national referendum. UK referendum I 1975 supports entry 2:1. 1981 – Greece joins EC 1986 – Spain and Portugal join EC 1987 – European Single Act signed 1988 – Regional Aid doubled. The expansion of structural funds to poorer regions and countries 1993 – Maastricht Treaty ratified 1995 – Borders come down as result of Schengen Agreement. UK does not join and Norway rejects membership of EU in second referendum 1998 – Talks start for major enlargement

3
Croatia – quite soon Bosnia – Herzegovina – early next decade Macedonia – 2012 or possibly before Montenegro – again within the next 4 to 6 years Serbia – probably early next decade, depends on both economic and political issues Albania – 2015? Turkey – 2015?

4
Europe continues to enjoy economic growth, solidarity, the spread of democratic forces in countries once under dictatorship Also – job creation, safer products, lower prices, greater choice in such sectors as telecommunications, banking and travel The EU is NOT just about wealth it has values – peace, prosperity, freedom and social justice

5
Stabilisation and Association Agreements Work towards acquis – the 35 chapters of The EU Regular progress reports Inflows of funds – since 1991 Western Balkans have received Euro 20 billion in assistance. Funds now simplified into Instrument of Pre-Accession Assistance (IPA) The EU considers itself to be dynamic and as David Milliband said in Bruges last year it should expand further
 The EU considers itself to be dynamic and as David Milliband said in Bruges last year it should expand further.")
6
Though EU = 7% of world population it = 20% of world trade Risk is a major deciding factor of the way in which a is treated - public health, the environment and consumer protection dictate the rules that govern its trade, so chemicals are more closely regulated than pasta The high risk products are more harmonised than the low risk – countries can restrict trade under certain situations e.g. British beef Approximately 50% of all intra trade is covered by harmonised legislation

7
Has the internal market had benefits – 2.5m - 3.5m extra jobs, 900 billion Euros of wealth, which is equivalent to 6000 Euros per family. This should increase with the introduction of services agreement Next stage is internal market for capital – make funds is available as in US?

8
How have the ‘new’ members faired since 2004 - 2010 and the largest single enlargement since the founding of the EU? How have the ‘older’ members adjusted since the arrival of the new members? Will deeper or wider integration be the way forward?

9
New members trade with other EU countries Czech Rep = 79% Estonia = 73% Cyprus = 60% Latvia = 77% Lithuania = 58% Hungary = 72% Malta = 60% Poland = 75% Slovenia = 72% Slovakia = 80% UK = 57%

10
Belgium 75% Denmark 72% Germany 85% (highest) France 70% Ireland 65% Italy 62% Spain 72% Luxembourg 59% Netherlands 68% Austria 78% Portugal 80% Finland 54% Sweden 65%
 France 70% Ireland 65% Italy 62% Spain 72% Luxembourg 59% Netherlands 68% Austria 78% Portugal 80% Finland 54% Sweden 65%")
11
Euro billion China Export 483 Imports 436 EU Exports 883 Imports 941 Japan Exports 499 Imports 405 US Exports 765 Imports 1380

12
Bulgaria 5.5 Bulgaria Cyprus 3.7 Cyprus Czech Republic 6.1 Czech Republic Estonia 9.8 Estonia Hungary 4.1 Hungary Latvia 10.2 Latvia Lithuania 7.6 Lithuania Malta 2.5 Malta Poland 3.4 Poland Romania 8.5 Romania Slovakia 6.1 Slovakia Slovenia4.0 Slovenia

13
Austria 2.0 Austria Belgium 1.5 Belgium Denmark 3.2 Denmark Finland 2.9 Finland France 1.2 France Germany 0.9 Germany Greece 3.7 Greece Republic of Ireland 5.5 Republic of Ireland Italy 0.0 Italy Luxembourg 4.0Luxembourg Netherlands 1.5 Netherlands Portugal 0.4 Portugal Spain 3.4 Spain Sweden 2.7Sweden United Kingdom 2.25 United Kingdom

14
Does the centralised state lose authority as more decisions are taken in Brussels? If so, can European Social Democracy adapt or will less government intervention styled politics emerge? How have the once members of the Warsaw Pact adapted? Were the wrongs of Yalta put right? Are some of the new members more Atlanticist in approach and so easier for UK to get on with?

15
The US likes EU expansion – why? Does the introduction of new laws mean a real change in attitude – e.g. gypsies? Will there actually be a unified foreign and defence policy – if there had been might US have stalled with invasion of Iraq? What of the relations with Russia post enlargement?

16
Kaliningrad Shift in Russian focus to Asia and China and EU- Russia relations are now at best ‘cool’ Flex of economic might in recent energy problems However, it’s not all good news for US – look at problems of basing missiles in Czech Republic and Poland Will the problems of recent expansion cause Turkish entry to be delayed – will social and cultural compatibility be added to the list of human rights, power of military etc? Is it best to resolve these issues at national or Pan- European level?

17
500 million and set to rise By global standards – high earners Standardised tastes Credit facilities Few barriers Trans national networks Benefits to AD Benefits to AS

18
What you must show before entering the Euro Zone Price stability, measured according to the rate of inflation in the three best performing Member States; Long-term interest rates close to the rates in the countries with the best inflation results; An annual budget deficit which does not exceed 3% of gross domestic product (GDP) and total government debt which does not exceed 60% of GDP or which is falling steadily towards that figure; Stability in the exchange rate of the national currency on exchange markets The exchange-rate mechanism of the European Monetary System requires this stability to be demonstrated and sustained for two years.
 and total government debt which does not exceed 60% of GDP or which is falling steadily towards that figure; Stability in the exchange rate of the national currency on exchange markets The exchange-rate mechanism of the European Monetary System requires this stability to be demonstrated and sustained for two years.")
19
Stability and international recognition Price transparency/comparisons/one catalogue/bank account/potentially lower interest rates – EU wide capital market? Disadvantages – we probably know these Cyprus and Malta to join in 2008 Baltic States moving towards criteria Possible Hungary and Slovakia EU thinks all new members in by early next decade – out Denmark(?), Sweden – may be a new referendum and UK
, Sweden – may be a new referendum and UK.")
20
Regional/Cohesion Policies Converging economies Economic independence ECB transparency Stability of Euro Foreign Reserve holdings Will it survive the current crisis?

21
Taken as a single entity, the European Union has the largest economy in the world, with an estimated nominal GDP of €11.6 ($14.5) trillion in 2006 accounting for 35% of world GDP (the second largest economy is USA, with a GDP of $13.2 trillion).USA
 trillion in 2006 accounting for 35% of world GDP (the second largest economy is USA, with a GDP of $13.2 trillion).USA")
22
It appears that the EU has attained the capacity for higher growth that is historically due to the EU's new member states potential to expand at a higher rate than traditional industrial powers of Europe. Possibility for a twin speed Europe?

23
Differences between member states are also significant. GDP per capita is often 10% to 25% higher than the EU average in the "older" western member states, but only comprises one-third to two-thirds of the EU average in most eastern member states, as well as in potential membership candidates such as Croatia, the former Yugoslav Republic of Macedonia and Turkey

24
By comparison, United States GDP per capita is 35% higher than the EU average: Japanese GDP per capita is approximately 15% higher The EU currently imports 82% of its oil and 57% of its gas, making it the world's leading importer of these fuelsoilgas So, there is someway to go!

25
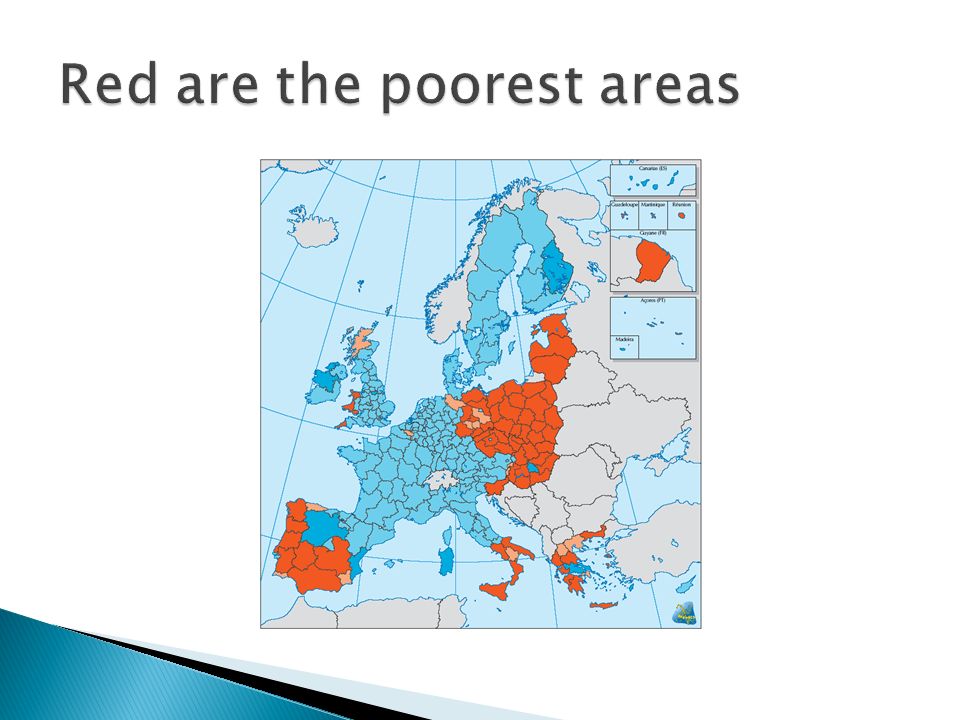
After growing almost 3% as a whole in 2006 the EU economy is predicted to stay robust well into 2008 with average growth over those two years averaging over 2.5% growth. Many economists agree the EU has attained the capacity for higher growth than historically due to the EU's new member states potential to expand at a higher rate than traditional industrial powers of Europe. But some countries are more poorer – what should be done about this?

26
Three new objectives Convergence (like old Obj 1: greater scope) RED on MAP Competitiveness (old Obj 2&3, tie to Lisbon) BLUE ON MAP Territorial co-operation (former Interreg) (and REC) A method based on what works: Programming, Partnership and Decentralised management Trying things out: then main streaming Loans for the first time in the regulations
 RED on MAP Competitiveness (old Obj 2&3, tie to Lisbon) BLUE ON MAP Territorial co-operation (former Interreg) (and REC) A method based on what works: Programming, Partnership and Decentralised management Trying things out: then main streaming Loans for the first time in the regulations")
28
Making Europe and its regions a more attractive place to invest and work expand and improve transport infrastructures improve the environmental contribution to growth and jobs address the intensive use of traditional energy sources II) Knowledge and innovation for growth increase and improve investment in RTD facilitate innovation and promote entrepreneurship promote the information society for all improve access to finance
 Knowledge and innovation for growth increase and improve investment in RTD facilitate innovation and promote entrepreneurship promote the information society for all improve access to finance")
29
III) More and better jobs attract and retain more people in employment and modernise social protection systems improve adaptability of workers and enterprises and the flexibility of the labour market increase investment in human capital through better education and skills administrative capacity health and the labour force
 More and better jobs attract and retain more people in employment and modernise social protection systems improve adaptability of workers and enterprises and the flexibility of the labour market increase investment in human capital through better education and skills administrative capacity health and the labour force")
31
Does it work? ◦ across Member States yes ◦ within Member States less What will enlargement do (Poland 40 million, Spain 40 million) ◦ from 15 to 27 Member States and may be 30 soon ◦ new Member States are much poorer ◦ pressure on budget Causes friction between member-states ◦ Poor vs. rich ◦ South vs. North ◦ East vs. West
 ◦ from 15 to 27 Member States and may be 30 soon ◦ new Member States are much poorer ◦ pressure on budget Causes friction between member-states ◦ Poor vs. rich ◦ South vs. North ◦ East vs. West.")
32
Think the future of UK in the global economy Changes in P5 membership Emergence of BRIC countries + Indonesia Greater integration – probably wider and not deeper Will UK ever join Euro How many more members could EU absorb? Any questions?

Similar presentations


 Presentation by Nigel Nagarajan Faculty Orientation for the 2009 Euro Challenge New York, November 25 th 2008 The 2009.>")
 Presentation by Nigel Nagarajan Student Orientation – 2009 Euro Challenge Miami-Florida European Union Center of Excellence.>")

>")


