Download presentation
Presentation is loading. Please wait.

2
Introduction to Statistics for the Social Sciences SBS200, COMM200, GEOG200, PA200, POL200, or SOC200 Lecture Section 001, Fall 2015 Room 150 Harvill Building 10:00 - 10:50 Mondays, Wednesdays & Fridays. http://courses.eller.arizona.edu/mgmt/delaney/d15s_database_weekone_screenshot.xlsx
3
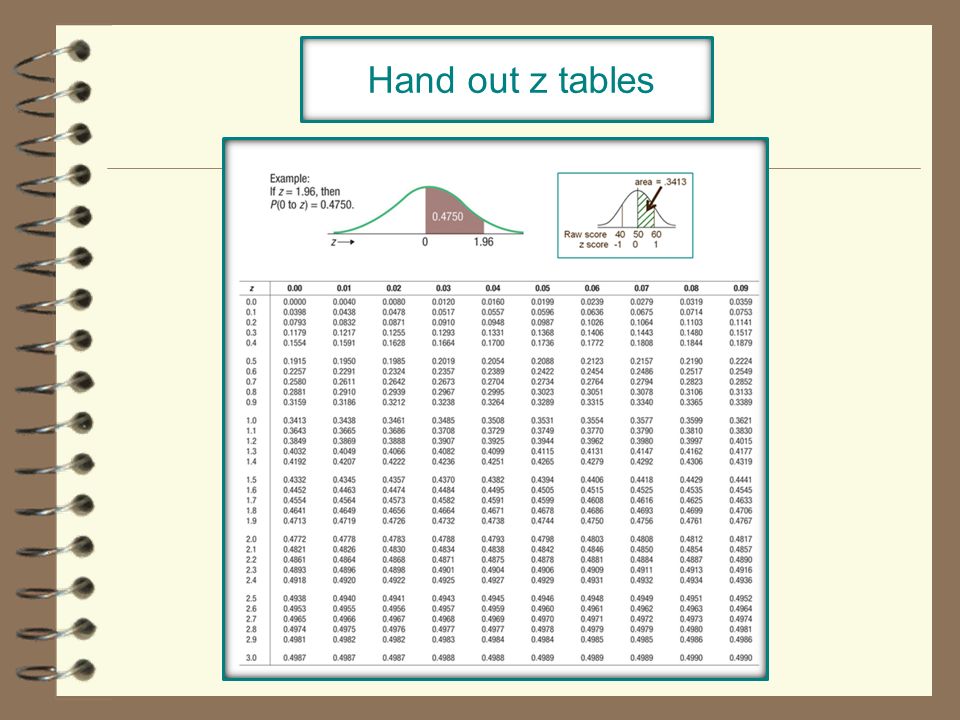
Hand out z tables

4
Everyone will want to be enrolled in one of the lab sessions Labs continue this week, Project 1

7
Please re-register your clicker http://student.turningtechnologies.com/

8
By the end of lecture today 10/2/15 Counting ‘standard deviationses’ – z scores Connecting raw scores, z scores and probability Connecting probability, proportion and area of curve Percentiles

9
Before next exam (October 16th) Please read chapters 1 - 8 in OpenStax textbook Please read Chapters 10, 11, 12 and 14 in Plous Chapter 10: The Representativeness Heuristic Chapter 11: The Availability Heuristic Chapter 12: Probability and Risk Chapter 14: The Perception of Randomness Schedule of readings
 Please read chapters in OpenStax textbook Please read Chapters 10, 11, 12 and 14 in Plous Chapter 10: The Representativeness Heuristic Chapter 11: The Availability Heuristic Chapter 12: Probability and Risk Chapter 14: The Perception of Randomness Schedule of readings")
10
Homework Assignment Assignment 9 Please complete this homework worksheet Finding z scores and areas under the curve Due: Monday, October 5th

11
Scores, standard deviations, and probabilities The normal curve always has the same shape. They differ only by having different means and standard deviation

12
Raw Scores (actual data) Distance from the mean (z scores) Proportion of curve (area from mean) convert We care about this! “percentiles” “percent of people” “proportion of curve” “relative position” We care about this! What is the actual number on this scale? “height” vs “weight” “pounds” vs “test score” Raw Scores (actual data) Distance from the mean (z scores) Proportion of curve (area from mean) convert Raw scores, z scores & probabilities z = -1z = 1 68% z = -1z = 1 68%
 Distance from the mean (z scores) Proportion of curve (area from mean) convert Raw scores, z scores & probabilities z = -1z = 1 68% z = -1z = 1 68%.")
13
Raw Scores Area & Probability Z Scores Formula z table Have raw score Find z Have z Find raw score Have area Find z Have z Find area Normal distribution Raw scores z-scores probabilities

14
Writing Assignment Let’s do some problems Mean = 50 Standard deviation = 10

15
Let’s do some problems Mean = 50 Standard deviation = 10 Find the percentile rank for score of 60 ? Find the area under the curve that falls below 60 means the same thing as 60 Problem 1

16
Let’s do some problems Mean = 50 Standard deviation = 10 1) Find z score z score = 60 - 50 10 Hint always draw a picture! Find the percentile rank for score of 60 60 2) Go to z table - find area under correct column (.3413) 4) Percentile rank or score of 60 = 84.13% 3) Look at your picture - add.5000 to.3413 =.8413 ?.3413.5000 = 1 Raw Scores (actual data) Distance from the mean ( from raw to z scores) Proportion of curve (area from mean) z-table (from z to area) Problem 1
 Go to z table - find area under correct column (.3413) 4) Percentile rank or score of 60 = 84.13% 3) Look at your picture - add.5000 to.3413 = = 1 Raw Scores (actual data) Distance from the mean ( from raw to z scores) Proportion of curve (area from mean) z-table (from z to area) Problem 1.")
17
Let’s do some problems Mean = 50 Standard deviation = 10 Find the percentile rank for score of 60 ? Find the area under the curve that falls below 60 means the same thing as 60 Problem 1

18
Let’s do some problems Mean = 50 Standard deviation = 10 1) Find z score z score = 60 - 50 10 Hint always draw a picture! Find the percentile rank for score of 60 60 2) Go to z table - find area under correct column (.3413) 4) Percentile rank or score of 60 = 84.13% 3) Look at your picture - add.5000 to.3413 =.8413 ?.3413.5000 = 1 Raw Scores (actual data) Distance from the mean ( from raw to z scores) Proportion of curve (area from mean) z-table (from z to area) Problem 1
 Go to z table - find area under correct column (.3413) 4) Percentile rank or score of 60 = 84.13% 3) Look at your picture - add.5000 to.3413 = = 1 Raw Scores (actual data) Distance from the mean ( from raw to z scores) Proportion of curve (area from mean) z-table (from z to area) Problem 1.")
19
Mean = 50 Standard deviation = 10 1) Find z score z score = 75 - 50 10 Hint always draw a picture! Find the percentile rank for score of 75 75 2) Go to z table ? z score = 25 10 = 2.5.4938 Problem 2
 Go to z table . z score = = Problem 2.")
20
Mean = 50 Standard deviation = 10 1) Find z score z score = 75 - 50 10 Hint always draw a picture! Find the percentile rank for score of 75 75 2) Go to z table ? z score = 25 10 = 2.5.4938 4) Percentile rank or score of 75 = 99.38% 3) Look at your picture - add.5000 to.4938 =.9938.5000 Problem 2
 Go to z table . z score = = ) Percentile rank or score of 75 = 99.38% 3) Look at your picture - add.5000 to.4938 = Problem 2.")
21
Mean = 50 Standard deviation = 10 1) Find z score z score = 45 - 50 10 Find the percentile rank for score of 45 45 ? 2) Go to z table z score = - 5 10 = -0.5 Raw Scores (actual data) Distance from the mean ( from raw to z scores) Proportion of curve (area from mean) z-table (from z to area) Problem 3
 Go to z table z score = = -0.5 Raw Scores (actual data) Distance from the mean ( from raw to z scores) Proportion of curve (area from mean) z-table (from z to area) Problem 3.")
22
Mean = 50 Standard deviation = 10 1) Find z score z score = 45 - 50 10 Find the percentile rank for score of 45 45 ? 2) Go to z table z score = - 5 10 = -0.5 ?.1915 Problem 3
 Go to z table z score = = Problem 3.")
23
Mean = 50 Standard deviation = 10 1) Find z score z score = 45 - 50 10 Find the percentile rank for score of 45 45 2) Go to z table z score = - 5 10 = -0.5 4) Percentile rank or score of 45 = 30.85% 3) Look at your picture - subtract.5000 -.1915 =.3085.1915 ?.3085 Raw Scores (actual data) Distance from the mean ( from raw to z scores) Proportion of curve (area from mean) z-table (from z to area) Problem 3
 Find z score z score = Find the percentile rank for score of ) Go to z table z score = = ) Percentile rank or score of 45 = 30.85% 3) Look at your picture - subtract = Raw Scores (actual data) Distance from the mean ( from raw to z scores) Proportion of curve (area from mean) z-table (from z to area) Problem 3")
24
Mean = 50 Standard deviation = 10 1) Find z score z score = 55 - 50 10 Find the percentile rank for score of 55 ? 2) Go to z table z score = 5 10 = 0.5 55 Raw Scores (actual data) Distance from the mean ( from raw to z scores) Proportion of curve (area from mean) z-table (from z to area) Problem 4
 Go to z table z score = 5 10 = Raw Scores (actual data) Distance from the mean ( from raw to z scores) Proportion of curve (area from mean) z-table (from z to area) Problem 4.")
25
Mean = 50 Standard deviation = 10 1) Find z score z score = 55 - 50 10 Find the percentile rank for score of 55 2) Go to z table z score = 5 10 = 0.5 55.1915 ? Problem 4

26
Mean = 50 Standard deviation = 10 1) Find z score z score = 55 - 50 10 Find the percentile rank for score of 55 ? 2) Go to z table z score = 5 10 = 0.5 4) Percentile rank or score of 55 = 69.15% 3) Look at your picture - add.5000 +.1915 =.6915 55.1915.5 Raw Scores (actual data) Distance from the mean ( from raw to z scores) Proportion of curve (area from mean) z-table (from z to area) Problem 4
 Go to z table z score = 5 10 = 0.5 4) Percentile rank or score of 55 = 69.15% 3) Look at your picture - add = Raw Scores (actual data) Distance from the mean ( from raw to z scores) Proportion of curve (area from mean) z-table (from z to area) Problem 4.")
27
Find the score for z = -2 Mean = 50 Standard deviation = 10 raw score = mean + (z score)(standard deviation) Raw score = 50 + (-2)(10) Raw score = 50 + (-20) = 30 Hint always draw a picture! Find the score that is associated with a z score of -2 ? 30 Raw Scores (actual data) Distance from the mean ( from raw to z scores) Proportion of curve (area from mean) z-table (from z to area) Please note: When we are looking for the score from proportion we use the z-table ‘backwards’. We find the closest z to match our proportion
 Distance from the mean ( from raw to z scores) Proportion of curve (area from mean) z-table (from z to area) Please note: When we are looking for the score from proportion we use the z-table ‘backwards’. We find the closest z to match our proportion.")
28
Mean = 50 Standard deviation = 10 Find the score for percentile rank of 77%ile.7700 ? ? Raw Scores (actual data) Distance from the mean ( from raw to z scores) Proportion of curve (area from mean) z-table (from z to area) Please note: When we are looking for the score from proportion we use the z-table ‘backwards’. We find the closest z to match our proportion Problem 5
 Distance from the mean ( from raw to z scores) Proportion of curve (area from mean) z-table (from z to area) Please note: When we are looking for the score from proportion we use the z-table ‘backwards’. We find the closest z to match our proportion Problem 5.")
29
Mean = 50 Standard deviation = 10 Find the score for percentile rank of 77%ile 1) Go to z table - find z score for for area.2700 (.7700 -.5000) =.27.7700 ? ?.5.27.5.27 area =.2704 (closest I could find to.2700) z = 0.74 Please note: When we are looking for the score from proportion we use the z-table ‘backwards’. We find the closest z to match our proportion Problem 5.5 +.27 =.77
 z = 0.74 Please note: When we are looking for the score from proportion we use the z-table ‘backwards’. We find the closest z to match our proportion Problem =.77.")
30
Mean = 50 Standard deviation = 10 Find the score for percentile rank of 77%ile ?.5.27 2) x = mean + (z)(standard deviation) x = 50 + (0.74)(10) x = 57.4 Please note: When we are looking for the score from proportion we use the z-table ‘backwards’. We find the closest z to match our proportion x = 57.4.7700 ?.5.27 Problem 5

31
Mean = 50 Standard deviation = 10 Find the score for percentile rank of 55%ile.5500 ? ? Raw Scores (actual data) Distance from the mean ( from raw to z scores) Proportion of curve (area from mean) z-table (from z to area) Problem 6 Please note: When we are looking for the score from proportion we use the z-table ‘backwards’. We find the closest z to match our proportion
 Distance from the mean ( from raw to z scores) Proportion of curve (area from mean) z-table (from z to area) Problem 6 Please note: When we are looking for the score from proportion we use the z-table ‘backwards’. We find the closest z to match our proportion.")
32
Mean = 50 Standard deviation = 10 Find the score for percentile rank of 55%ile 1) Go to z table - find z score for for area.0500 (.5500 -.5000) =.05.5500 ? ?.5.05.5.05 area =.0517 (closest I could find to.0500) z = 0.13 Please note: When we are looking for the score from proportion we use the z-table ‘backwards’. We find the closest z to match our proportion Problem 6.5 +.05 =.55
 z = 0.13 Please note: When we are looking for the score from proportion we use the z-table ‘backwards’. We find the closest z to match our proportion Problem =.55.")
33
Mean = 50 Standard deviation = 10 Find the score for percentile rank of 55%ile 1) Go to z table - find z score for for area.0500 (.5500 -.5000) =.05.5500 ? ?.5.05.5.05 area =.0517 (closest I could find to.0500) z = 0.13 Please note: When we are looking for the score from proportion we use the z-table ‘backwards’. We find the closest z to match our proportion Problem 6
 z = 0.13 Please note: When we are looking for the score from proportion we use the z-table ‘backwards’. We find the closest z to match our proportion Problem 6.")
34
Mean = 50 Standard deviation = 10 Find the score for percentile rank of 55%ile 1) Go to z table - find z score for for area.0500 (.5500 -.5000) =.0500 area =.0517 (closest I could find to.0500) z = 0.13.5500 ? ?.5.05.5.05 2) x = mean + (z)(standard deviation) x = 50 + (0.13)(10) x = 51.3 Please note: When we are looking for the score from proportion we use the z-table ‘backwards’. We find the closest z to match our proportion x = 51.3 Problem 6
 x = mean + (z)(standard deviation) x = 50 + (0.13)(10) x = 51.3 Please note: When we are looking for the score from proportion we use the z-table ‘backwards’. We find the closest z to match our proportion x = 51.3 Problem 6.")
35
nearest z = 1.64 Go to table.4500 Normal Distribution has a mean of 50 and standard deviation of 4. Determine value below which 95% of observations will occur. Note: sounds like a percentile rank problem x = mean + z σ = 50 + (1.64)(4) = 56.56 Additional practice Problem 7
(4) = Additional practice Problem 7.")
36
nearest z = - 1.88 Go to table.4700 Normal Distribution has a mean of $2,100 and s.d. of $250. What is the operating cost for the lowest 3% of airplanes. Note: sounds like a percentile rank problem = find score for 3 rd percentile x = mean + z σ = 2100 + (-1.88)(250) = 1,630 Additional practice Problem 8
(250) = 1,630 Additional practice Problem 8.")
37
nearest z = 2.33 Go to table.4900 Normal Distribution has a mean of 195 and standard deviation of 8.5. Determine value for top 1% of hours listened. x = mean + z σ = 195 + (2.33)(8.5) = 214.805 Additional practice Problem 9
(8.5) = Additional practice Problem 9.")
38
. 75 th percentile Go to table.2500 nearest z =.67 x = mean + z σ = 30 + (.67)(2) = 31.34 z =.67 Additional practice Problem 10
(2) = z =.67 Additional practice Problem 10")
39
. 25 th percentile Go to table.2500 nearest z = -.67 x = mean + z σ = 30 + (-.67)(2) = 28.66 z = -.67 Additional practice Problem 11
(2) = z = -.67 Additional practice Problem 11")
40
. Try this one: Please find the (2) raw scores that border exactly the middle 95% of the curve Mean of 30 and standard deviation of 2 Go to table.4750 nearest z = 1.96 mean + z σ = 30 + (1.96)(2) = 33.92 Go to table.4750 nearest z = -1.96 mean + z σ = 30 + (-1.96)(2) = 26.08 Additional practice Problem 12
 raw scores that border exactly the middle 95% of the curve Mean of 30 and standard deviation of 2 Go to table.4750 nearest z = 1.96 mean + z σ = 30 + (1.96)(2) = Go to table.4750 nearest z = mean + z σ = 30 + (-1.96)(2) = Additional practice Problem 12")
41
. Try this one: Please find the (2) raw scores that border exactly the middle 95% of the curve Mean of 100 and standard deviation of 5 Go to table.4750 nearest z = 1.96 mean + z σ = 100 + (1.96)(5) = 109.80 Go to table.4750 nearest z = -1.96 mean + z σ = 100 + (-1.96)(5) = 90.20 Additional practice Problem 13
 raw scores that border exactly the middle 95% of the curve Mean of 100 and standard deviation of 5 Go to table.4750 nearest z = 1.96 mean + z σ = (1.96)(5) = Go to table.4750 nearest z = mean + z σ = (-1.96)(5) = Additional practice Problem 13")
42
. Try this one: Please find the (2) raw scores that border exactly the middle 99% of the curve Mean of 30 and standard deviation of 2 Go to table.4750 nearest z = 1.96 mean + z σ = 30 + (2.58)(2) = 35.16 Go to table.4750 nearest z = -1.96 mean + z σ = 30 + (-2.58)(2) = 24.84 Additional practice Problem 14
 raw scores that border exactly the middle 99% of the curve Mean of 30 and standard deviation of 2 Go to table.4750 nearest z = 1.96 mean + z σ = 30 + (2.58)(2) = Go to table.4750 nearest z = mean + z σ = 30 + (-2.58)(2) = Additional practice Problem 14")
43
Raw Scores Area & Probability Z Scores Formula z table Have raw score Find z Have z Find raw score Have area Find z Have z Find area Normal distribution Raw scores z-scores probabilities

Similar presentations