Download presentation
Presentation is loading. Please wait.

1
Predator-Prey Cycles and Effects of Climate Change
Hao Wang School of Mathematical and Statistical Sciences University of Alberta

2
Trends of Cycles Period Amplitude Incidence CO2 Predator-Prey Cycles
Temperature Global Climate Change Predator-Prey Cycles Hypothesis Trends of Cycles Period Amplitude Incidence

3
Does climate change have strong
effects on predator-prey cycles? What are the effects? How about feedback?

4
Predator-prey cycles

5
Top-down regulation: Prey limited by Predator Bottom-up regulation: “Predator” limited by “Prey”

6
Generic Predator-Prey System

7
Population Cycles Large groups 29% 204 694 All 33% 1 3 Bivalves
Gastropods 50% 6 12 Crustaceans 16% 13 79 Insects 43% 56 129 Fish 109 328 Mammals 13% 18 139 Bird Fraction Periodic # Testing # Taxon Large groups (Bruce Kendall, John Prendergast and Ottar Bjornstad 1998, Ecology Letters, 1: )
")
8
Nearly 30% of testing populations are cyclic.
Cycles occur mainly in mammal and fish populations. The incidence of cycles increases with latitude in mammals alone. There is no latitudinal gradient in cycle period. Cycle amplitude declines with latitude in some groups of fish. (Kendall et al 1998, Ecology Letters)
")
9
For mammals, why does the incidence of cycles increase with latitude?
(Kendall et al 1998, Ecology Letters)
")
10
Why does the incidence of cycles increase with latitude only in mammals?
Many fish, birds and insects can mitigate the effects of seasonality by migration, but few of mammals do so. (Kendall et al 1998, Ecology Letters)
")
11
Climate has strong effects on population cycles.
What’s the evolution direction of incidence and features of population cycles with climate change?

12
Population Cycles in a Small Mammal - Lemmings
brown lemming in Alaska collared lemming in Greenland

13
Empirical Data lemming (prey) density stoat (predator) density (Olivier Gilg, Ilkka Hanski et al 2003, Science 302: )
 .")
14
Lemming Background The population numbers of lemming fluctuate greatly over a period of 3-4 years until now. Ecologists suspect that such oscillations are controlled by a trophic mechanism. Their principal summer foods are moss and vascular plants. Lemmings are eaten by many animals, like weasels, arctic fox and a bigger number dies when they try to cross rivers, lakes or seas.

15
Trophic Mechanisms Brown lemmings in Alaska: bottom-up regulation (P.Turchin et al 2000, Nature). Collared lemmings in NE Greenland: top- down regulation (Olivier Gilg et al 2003, Science).
.")
16
The lemming cycle driven by predators
Top-down Regulation The lemming cycle driven by predators

17
For collared lemmings in NE Greenland, the
major sources of mortality are predation by stoats, arctic foxes, snowy owls and long-tailed skuas. Only the stoat is a specialist.

18
Lemming-Stoat Delayed Model
(Hao Wang, John Nagy, Olivier Gilg and Yang Kuang, Mathematical Biosciences)
")
19
Functional Response Test
(Olivier Gilg et al 2003, Science) Predation by stoat is modeled with Holling Type III functional response, which was used to incorporate a possible "refuge" for the lemming at very low densities. when lemmings are so dispersed, then they must become very hard to locate for the stoat.
 Predation by stoat is modeled with Holling Type III functional response, which was. used to incorporate a possible refuge for the lemming at very low densities. when. lemmings are so dispersed, then they must become very hard to locate for the stoat.")
20
Lemming-Stoat Delayed Model

21
Stoat Maturation Delay
The stoat maturation delay is about 3 months. The stoat juvenile/maturation death rate is chosen to be the maximum stoat death rate, 4/year.

22
Lemming-Stoat Delayed Model

23
Prey Dependent Death Rate
The stoat death rate depends on lemming density This is tested by Olivier Gilg from field.

24
Lemming-Stoat Delayed Model

25
Modified Logistic Growth
Per capita growth rate for the lemming mammals Population density x (Richard M. Sibly et al and John D. Reynolds et al 2005, Science)
")
26
Empirical Data Fitting

27
Sensitivity Analysis

29
Compare the lemming cycle to the snowshoe hare cycle
lynx hare

31
Hare-Lynx Delayed System
In general view, the snowshoe hare cycle is also controlled by predators like collared lemming in NE Greenland. Differences: (i) Holling Type II functional response; (ii) constant lynx death rate.
 Holling Type II functional response; (ii) constant lynx death rate.")
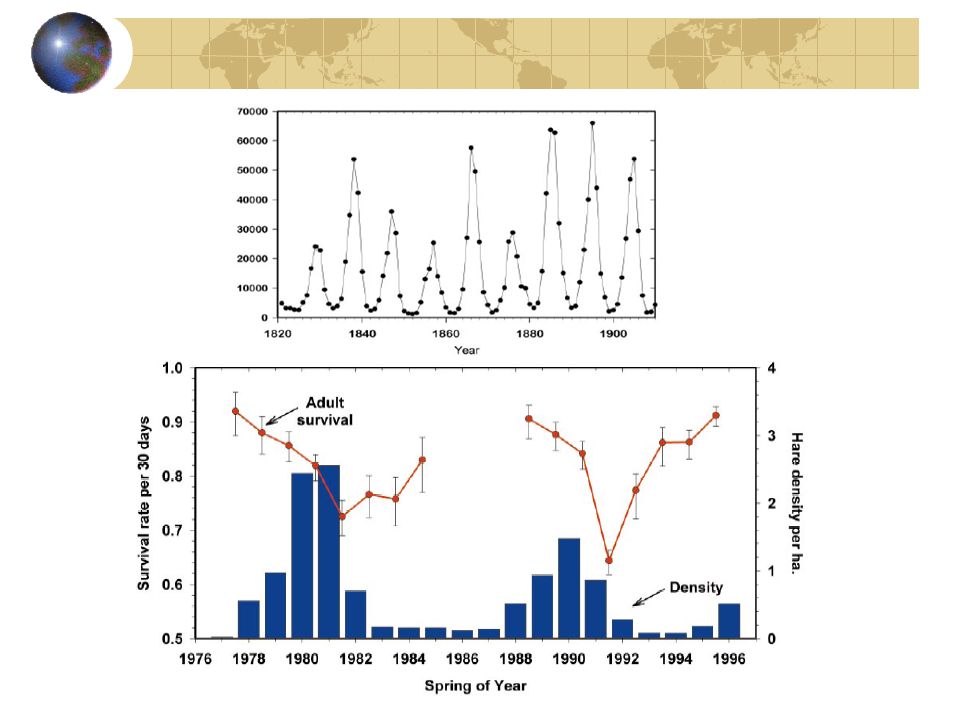
32
1 10-year period 1976 1996

33
Sensitivity Analysis

34
Goal: 4<10 Therefore the predator maturation delay is the key
Predation rate and conversion rate are comparable. Lynx maturation death rate is less than that of stoat which makes the period of snowshoe hare cycle smaller than the period of lemming cycle. Lynx maturation delay is 1.5 years, much larger than the stoat maturation delay, 3 months. This makes ‘4<10’ possible. Therefore the predator maturation delay is the key factor to generate different periods (4-year and 10- year) of lemming and hare cycles.
 of lemming and hare cycles.")
35
Maturation Hypothesis
Climate change leads to variation of predator maturation period.

36
Who knows the evolution direction?

37
Climate change results in more frequent
Snow Melt Hypothesis Climate change results in more frequent freeze-thaw events leading to a more shallow and icy snow pack, which will probably act to expose small mammals to predators…… (Callaghan et al 2004, Ambio; Callaghan et al 1995, Phil. Trans. R. Soc. Lond. A)
")
38
Lemming-Stoat Delayed Model
predation rate increases with snow melt lemming stoat

39
past present future

40
Observation For collared lemmings in NE Greenland, period of the cycle is decreasing and amplitude is almost unchanged. Climate change has different effects on lemming cycles in different locations because of different mechanisms triggering them.

Similar presentations