Download presentation
Presentation is loading. Please wait.

1
Freshwater Discharges to Central Coast Marine Protected Areas and the Nearshore Environment Karen R. Worcester David M. Paradies Central Coast Ambient Monitoring Program

3
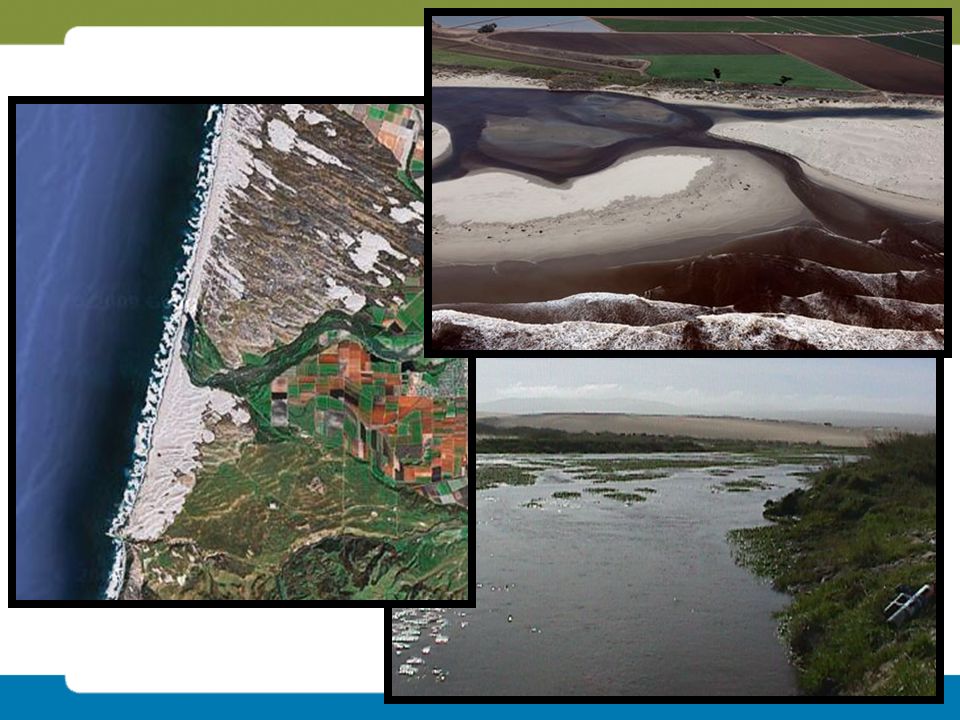
How does runoff from watersheds influence nearshore areas, and are there concerns for MPAs?

4
Monterey Bay Santa Barbara Channel Central Coast Marine Protected Areas and CCAMP Coastal Confluences Marine Protected Areas CCAMP Coastal Confluence Sites Monterey Bay Santa Barbara Channel

5
Our monthly data includes nutrients, pathogen indicators, zinc and copper, solids, salts, and physical parameters. Our flow data calibrates a daily flow model, available for all coastal confluence sites.

6
Typical pollutants found in surface runoff to the ocean Nutrients Pathogens Metals Sediment Pesticides and PCBs Petroleum hydrocarbons Other substances, such as phthalates, polybrominated diphenyl ethers (PBDEs)
")
7
Areas of Focus and Collaboration Sea otter epidemiology CDFW – Marine Wildlife Veterinary Care and Research Center (MWVCRC) U.C. Davis Nutrient loading and harmful algal blooms UCSC - Kudela and Lane CDFW – MWVCRC Chemical pollutants SWAMP CCLEAN

8
Central Coast Water Board and Range of the Southern Sea Otter

9
Primary Causes of Sea Otter Death www.seaotterresearch.org

10
Areas of high mortality due to protozoal and bacterial disease associated with high fresh water inflows (and other factors) Consumption of bivalves and other filter feeders may be a primary mechanism of infection Links to numerous publications by the CDFW / U.C. Davis group available through our website: www.ccamp.orgwww.ccamp.org CDFW / U.C. Davis research on mortality in sea otters show:

11
Blue-green Algal Toxins Over 30 otter deaths associated with microcystinOver 30 otter deaths associated with microcystin Major blooms in Pinto LakeMajor blooms in Pinto Lake Pilot stream mouth monitoring shows toxins present in multiple watershedsPilot stream mouth monitoring shows toxins present in multiple watersheds

12
Complex nutrient dynamics involve silica, iron, nitrate and other nutrients Anthropogenic nitrate and urea may initiate and exacerbate blooms and toxicity Toxic Marine Phytoplankton

13
In 2007 and 2008, MBARI and USCS researchers showed red tide initiation in low salinity areas at known nutrient discharges from land Hundreds of sea birds were killed in these events

14
For more information on this research, contact Kim Fulton-Bennett at MBARI: (831) 775-1835; kfb@mbari.org
 ;")
15
Nitrate averages (mg/l as N), north to south CCAMP Coastal Confluences Data
, north to south CCAMP Coastal Confluences Data")
16
Salinas and Pajaro river systems discharge 95% of the river nitrate load to Monterey Bay 90,000 acres of irrigated agricultural land in these two watersheds Concentrations up to 5 times the drinking water standard Over 10 million kg NO3-N loaded to Monterey Bay in past 10 years (CCLEAN)
")
17
Toxic Chemicals Monterey County has the highest rate of chemical application per acre of diazinon and pyrethroid pesticides in California Two Marine Protected Areas, Elkhorn and Moro Cojo Slough, receive direct drainage from agricultural lands; several others are influenced by river discharges 2008 Salinas Watershed applications: 100,000 lbs diazinon 18,000 lbs permethrin 40,000 lbs chlorpyrifos 40,000 lbs malathion

20
Questions? Partnerships? kworcester@waterboards.ca.gov (805) 549-3333
")
22
DDT (ug/kg) in sand crabs (Northern Santa Cruz County to Santa Barbara County, UCSB 2002)
 in sand crabs (Northern Santa Cruz County to Santa Barbara County, UCSB 2002)")
23
Other evidence of anthropogenic impacts of nitrogen: Part of doctoral dissertation by J. Lane, U.C. Santa Cruz, incorporating CCAMP loading data River inputs of nitrate predominate over upwelling 28% of the timeRiver inputs of nitrate predominate over upwelling 28% of the time Overall increasing trends in loading from riversOverall increasing trends in loading from rivers Nitrate ratios in river discharges in the Monterey Bay area are “extreme” compared to other sources and other river systems Salinas River N:P > 3000 Mississippi River N:P = 15Nitrate ratios in river discharges in the Monterey Bay area are “extreme” compared to other sources and other river systems Salinas River N:P > 3000 Mississippi River N:P = 15

Similar presentations