Download presentation
Presentation is loading. Please wait.

1
Chapter 7 Calculation of Pearson Coefficient of Correlation, r and testing its significance

2
From previous lecture:
SSxx = Σx2 – (Σx)2 n SSxy = Σxy – (Σx) (Σy) n b = SSxy and a = y - b x SSxx Today’s lecture: we are going to calculate the correlation coefficient of the two variables, x and y, called the Pearson Product Moment Correlation Coefficient, r The values of SSxy, SSxx, SSyy can also be obtained by using the following basic formulas: SSxy = Σ(x – x)(y – y) SSxx = Σ (x – x)2 SSyy = Σ (y – y)2 But these formulas take longer to make calculations since you have to calculate The means x and y NOTE: x and y are denoted as means for this course only. The line should appear on top of the letters x and y.
2. n. SSxy = Σxy – (Σx) (Σy) n. b = SSxy and a = y - b x. SSxx. Today’s lecture: we are going to calculate the correlation coefficient of the. two variables, x and y, called the Pearson Product Moment Correlation Coefficient, r. The values of SSxy, SSxx, SSyy can also be obtained by using the following. basic formulas: SSxy = Σ(x – x)(y – y) SSxx = Σ (x – x)2. SSyy = Σ (y – y)2. But these formulas take longer to make calculations since you have to calculate. The means x and y. NOTE: x and y are denoted as means. for this course only. The line. should appear on top of the. letters x and y.")
3
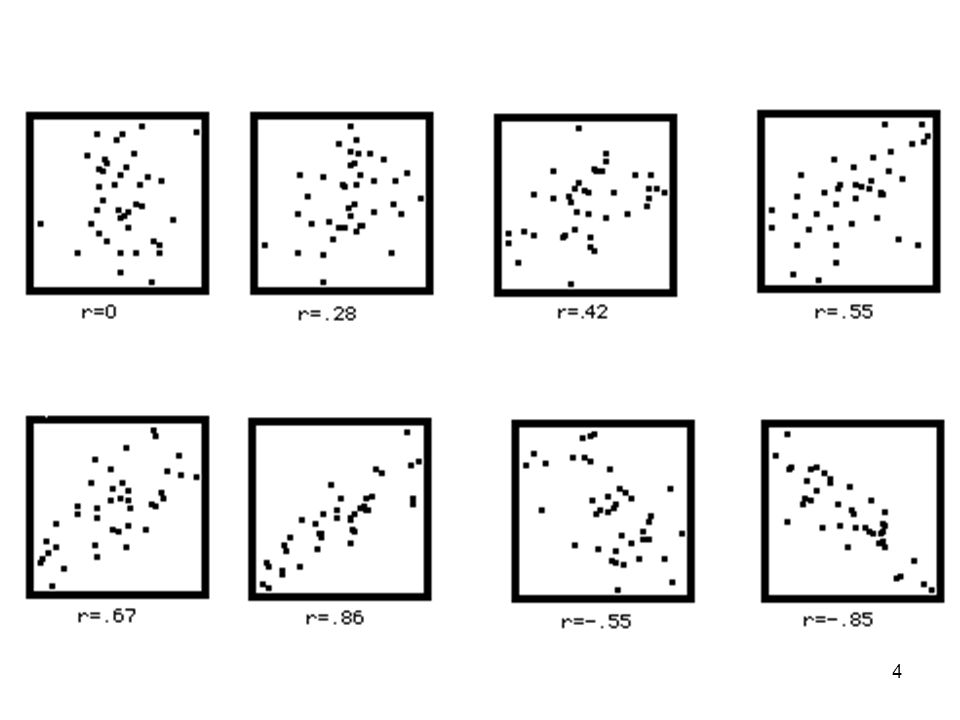
Pearson Product Moment Correlation Coefficient, r
r measures the strength of the relationship between two variables: x and y Examples of different strengths of relationships between variables x and y: Strong positive correlation Weak positive correlation Weak negative correlation Strong negative correlation

5
What is the correlation coefficient of the scatterplot below?
The value of r ranges from -1 to +1.

6
Pearson Product Moment Coefficient of Correlation, r is given by:
SSxy r = SSxx SSyy Example: Calculate the Pearson Product Moment Coefficient of Correlation, r to show the relationship between Maths and Science marks for Form 5A: Maths Science

7
STEP 1: Calculate Σx, Σy, Σxy, Σx2
Maths, x Science, y xy x y2 Σx = 212 Σy = 64 Σxy = 2150 Σx2 = 7222 Σy2 = 646 STEP 2: Calcute SSxy, SSxx and SSyy SSxy = Σxy – (Σx) (Σy) n = 2150 – (212)(64) /7 = SSxx = Σx2 – (Σx)2 n = 7222 – (212)2 / 7 = SSyy = Σy2 – (Σy)2 n = 646 – (64)2 / 7 =
 (Σy) n. = 2150 – (212)(64) /7. = SSxx = Σx2 – (Σx)2. n. = 7222 – (212)2 / 7. = SSyy = Σy2 – (Σy)2. n. = 646 – (64)2 / 7. =")
8
STEP 3: Substitute inside the r formula:
SSxy r = = = .96 SSxx SSyy ( ) ( ) The linear correlation coefficient is .96 (rounded to 2 decimal places) Interpretation: Maths and Science marks are strongly correlated. The square of the correlation, called the coefficient of determination, r2 = (.96)2 = .96 indicates that Maths marks account for 96% of the variance of the Science marks in this case.
 ( ) The linear correlation coefficient is .96 (rounded to 2 decimal places) Interpretation: Maths and Science marks are strongly correlated. The square of the correlation, called the coefficient of determination, r2 = (.96)2 = .96 indicates that Maths marks account for 96% of the variance. of the Science marks in this case.")
9
STEP 4: Test the significance of r obtained by stating the null hypothesis that
there are no significant relationship between Maths and Science scores. To test the significance of the r value obtained, you will first need to set the level of significance you wish to test, say at 1% or at p < .01. You can test the hypothesis about the population correlation coefficient ρ using the sample correlation coefficient, r. We can use the t distribution to make this test. n - 2 t = r 1 – r2 Where n – 2 are the degrees of freedom.

10
zero, that is ρ = 0. The alternative hypothesis can be:
The null hypothesis is that the linear correlation coefficient between 2 variables is zero, that is ρ = 0. The alternative hypothesis can be: linear correlation coefficient between the 2 variables is less than zero, ρ < 0 linear correlation coefficient between the 2 variables is more than zero, ρ > 0 linear correlation coefficient between the 2 variables is not equal to zero, ρ≠ 0 State the null hypothesis: (ρ is the population correlation coefficient) Ho: ρ = 0 (The linear correlation coefficient is zero in the population) H1 : ρ > 0 (The linear correlation coefficient is positive in the population) means One-tailed (We test H1: the positive correlation coefficient only when it is impossible for the correlation to be negative) (Otherwise we have to test H1: ρ≠ 0, when we wish to test for correlations both positive or negative two-tailed test) STEP 5: Select the distribution to use. The population distribution for both variables are normally distributed. Hence, we can use the t distribution to perform this test about the linear correlation coefficient STEP 6: Determine the rejection and nonrejection regions
 Ho: ρ = 0 (The linear correlation coefficient is zero in the population) H1 : ρ > 0 (The linear correlation coefficient is positive in the population) means One-tailed. (We test H1: the positive correlation coefficient only when it is impossible for the. correlation to be negative) (Otherwise we have to test H1: ρ≠ 0, when we wish to test for correlations both positive. or negative two-tailed test) STEP 5: Select the distribution to use. The population distribution for both variables are normally distributed. Hence, we can use the t distribution to perform this test about the linear. correlation coefficient. STEP 6: Determine the rejection and nonrejection regions.")
11
STEP 6: Determine the rejection and nonrejection regions
The significance level you have chosen for this test is 1%. From the alternative hypothesis, we know that the test is right-tailed. Hence Area in the right tail of the t distribution = .01 df = n – 2 = 7 – 2 = 5 From the t distribution table, the critical value of t is The rejection and nonrejection regions for this test are as shown below: Do not Reject Ho Reject Ho 3.365 Critical Value of t

12
STEP 7: Calculate the value of the test statistic, t
n - 2 t = r 1 – r2 7 - 2 t = = 1 – (.96)2 STEP 8: Make a decision The value of the test statistic t = is greater than the critical value of t = and it falls in the rejection region. Hence, we reject the null hypothesis and conclude that there is a significant, positive linear relationship between Maths and Science marks
2. STEP 8: Make a decision. The value of the test statistic t = is greater than the critical value. of t = and it falls in the rejection region. Hence, we reject the null hypothesis. and conclude that there is a significant, positive linear relationship between. Maths and Science marks.")
13
Hypothesis A hypothesis is a specific statement about on aspect of the population e.g. its mean, or its variance. A null hypothesis is a specific statement that indicates that something has a “no effect” or “no difference” between two situations. Eg. There is no effect of the treatment on students’ motivation Or There are no gender differences in Mathematics scores.

14
Alternative Hypothesis
An alternative hypothesis is the opposite of the null hypothesis. Eg. There is a relationship between academic achievement and motivation a two-tailed hypothesis A one-tail hypothesis only tests on one direction. Eg, There boys are better in Mathematics than girls

15
A hypothesis is a statement about the POPULATION and not the sample.
You cannot write a hypothesis as: Ho: This is not correct since can be measured accurately. We need an hypothesis to estimate the population mean

16
Hypothesis Testing 1. State the null and alternative hypothesis
2. Select the distribution to use 3. Determine the rejection and nonrejection regions 4. Calculate the value of the test statistic 5. Make a decision

17
Hypothesis Testing – Example using Correlation
Step 1. State the null and alternative hypothesis Ho: ρ = 0 (The linear correlation coefficient is zero in the population) H1 : ρ > 0 (The linear correlation coefficient is positive in the population) means One-tailed Or H1: ρ ≠ 0 (Means two possibilities, ρ > 0 or ρ < 0 => Two tailed test)
 H1 : ρ > 0 (The linear correlation coefficient is positive in the population) means One-tailed. Or H1: ρ ≠ 0 (Means two possibilities, ρ > 0 or ρ < 0 => Two tailed test)")
18
STEP 2. Select the distribution to use
The population distribution for both variables are normally distributed. Hence, we can use the t distribution to perform this test about the linear correlation coefficient

19
STEP 3: Determine the rejection and nonrejection regions
The significance level you have chosen for this test is 1%. From the alternative hypothesis, we know that the test is right-tailed. Hence Area in the right tail of the t distribution = .01 df = n – 2 = 7 – 2 = 5 From the t distribution table, the critical value of t is The rejection and nonrejection regions for this test are as shown below: Do not Reject Ho Reject Ho 3.365 Critical Value of t

20
STEP 4: Calculate the value of the test statistic, t
n - 2 t = r 1 – r2 7 - 2 t = = 1 – (.96)2 STEP 5: Make a decision The value of the test statistic t = is greater than the critical value of t = and it falls in the rejection region. Hence, we reject the null hypothesis and conclude that there is a significant, positive linear relationship between Maths and Science marks
2. STEP 5: Make a decision. The value of the test statistic t = is greater than the critical value. of t = and it falls in the rejection region. Hence, we reject the null hypothesis. and conclude that there is a significant, positive linear relationship between. Maths and Science marks.")
21
Another way of calculating r – using the standard score method

22
School Class Size Achievement Test Cross-Product x Zx y Zy Zx.Zy A 25 0.15 80 B 14 -1.53 98 1.1 -1.68 C 33 1.38 50 -1.84 -2.54 D 28 0.61 82 0.12 0.07 E 20 -0.61 90 -0.37 Total=120 Total = 400 Total= -4.52 Mean = 24 Mean = 80 s = 6.54 s = 16.30

23
Do not Reject HO Reject HO r critical = -.878 R obtained = -.90 Decision: Sig at p < .05 Significantly negative relationship between Class Size and Achievement Test (r = -.90, p < .05)
")
24
Another method of calculating r – using the computational formula

25
Exercise 1 Explain the following concept. You may use graphs to illustrate each concept a) Perfect positive linear correlation b) Perfect negative linear correlation c) Strong positive linear correlation d) Strong negative linear correlation e) Weak positive linear correlation f) Weak negative linear correlation g) No linear correlation 2) For a sample data set, the linear correlation coefficient r has a positive value. Which of the following is true about the slope b of the regression line estimated for the same sample data? a) The value of b will be positive b) The value of b will be negative c) The value of b can be positive or negative 3) A population data set produced the following information. N = 250, Σx = 9880, Σy = 1456, Σxy = 85,080 Σx2 = 485, and Σy2 = 135,675 Find the linear correlation coefficient ρ. Ans: 0.25
 Perfect negative linear correlation. c) Strong positive linear correlation. d) Strong negative linear correlation. e) Weak positive linear correlation. f) Weak negative linear correlation. g) No linear correlation. 2) For a sample data set, the linear correlation coefficient r has a positive value. Which of the following is true about the slope b of the regression line estimated. for the same sample data a) The value of b will be positive. b) The value of b will be negative. c) The value of b can be positive or negative. 3) A population data set produced the following information. N = 250, Σx = 9880, Σy = 1456, Σxy = 85,080. Σx2 = 485,870 and Σy2 = 135,675. Find the linear correlation coefficient ρ. Ans:")
26
4) A sample data set produced the following information.
N = 10, Σx = 100, Σy = 220, Σxy = 3680 Σx2 = and Σy2 = 25,272 a) Find the linear correlation coefficient r. b) Using the 5% significance level, can you conclude the ρ is different from zero? 5) A sample data set produced the following information. N = 12, Σx = 66, Σy = 588, Σxy = 2244 Σx2 = and Σy2 = 58734 a) Find the linear correlation coefficient r. b) Using the 5% significance level, can you conclude the ρ is negative?
 Find the linear correlation coefficient r. b) Using the 5% significance level, can you conclude the ρ is different from zero 5) A sample data set produced the following information. N = 12, Σx = 66, Σy = 588, Σxy = Σx2 = 396 and Σy2 = a) Find the linear correlation coefficient r. b) Using the 5% significance level, can you conclude the ρ is negative")
27
6) The data on ages (in years) and prices (in hundred of dollars for eight
cars of a specific model are shown below: Age Prices Do you expect the ages and prices of cars to be positively or negatively related? Explain. b) Calculate the linear correlation coefficient. c) Test at the 5% significance level whether ρ is negative. 7) The following table lists the midterm and final term exam scores for 7 students in a statistics class. Midterm score Final Exam score Do you expect the midterm and final exam scores to be positively or negatively correlated? b) Plot a scatter diagram. By looking at the scatter diagram, do you expect the correlation coefficient between these 2 variables to be close to zero, 1, or -1. c) Find the correlation coefficient. Is the value of r consistent with what you expected in parts a and b? d) Using the 1% significance level, test whether the linear correlation coefficient is Positive.
 Calculate the linear correlation coefficient. c) Test at the 5% significance level whether ρ is negative. 7) The following table lists the midterm and final term exam scores for 7 students. in a statistics class. Midterm score Final Exam score Do you expect the midterm and final exam scores to be positively. or negatively correlated b) Plot a scatter diagram. By looking at the scatter diagram, do you expect the. correlation coefficient between these 2 variables to be close to zero, 1, or -1. c) Find the correlation coefficient. Is the value of r consistent with what you expected. in parts a and b d) Using the 1% significance level, test whether the linear correlation coefficient is. Positive.")
Similar presentations


 Association Between Variables Measured at the Interval-Ratio Level: Bivariate Correlation and Regression.>")


