Download presentation
Presentation is loading. Please wait.

1
Creating and Analyzing Weather Maps
Objective – You will construct field maps and learn to identify patterns that can be used to predict weather.

2
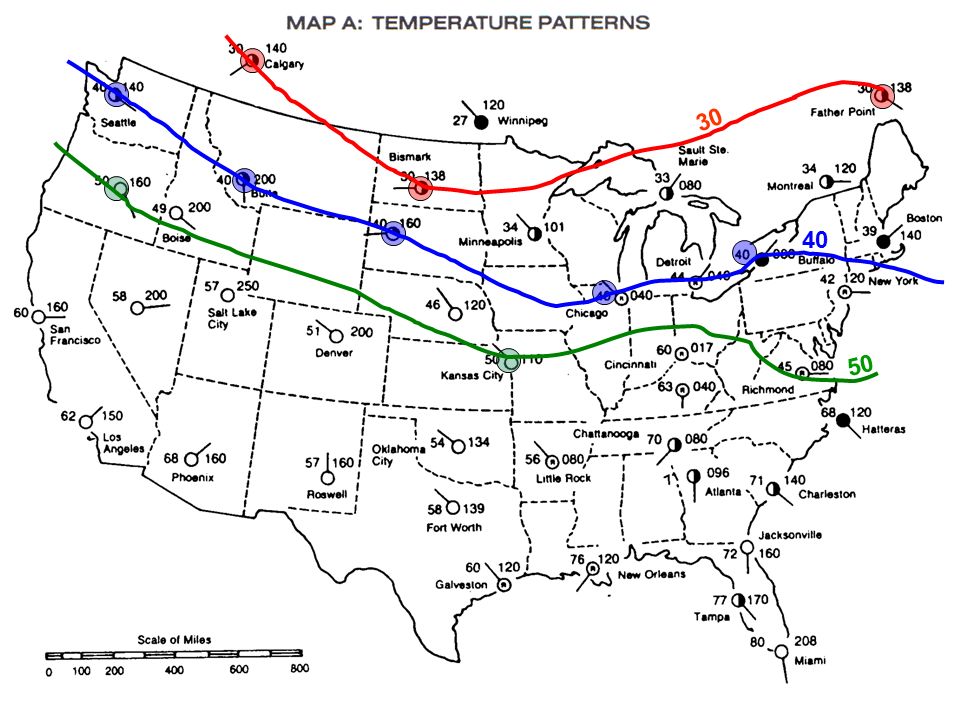
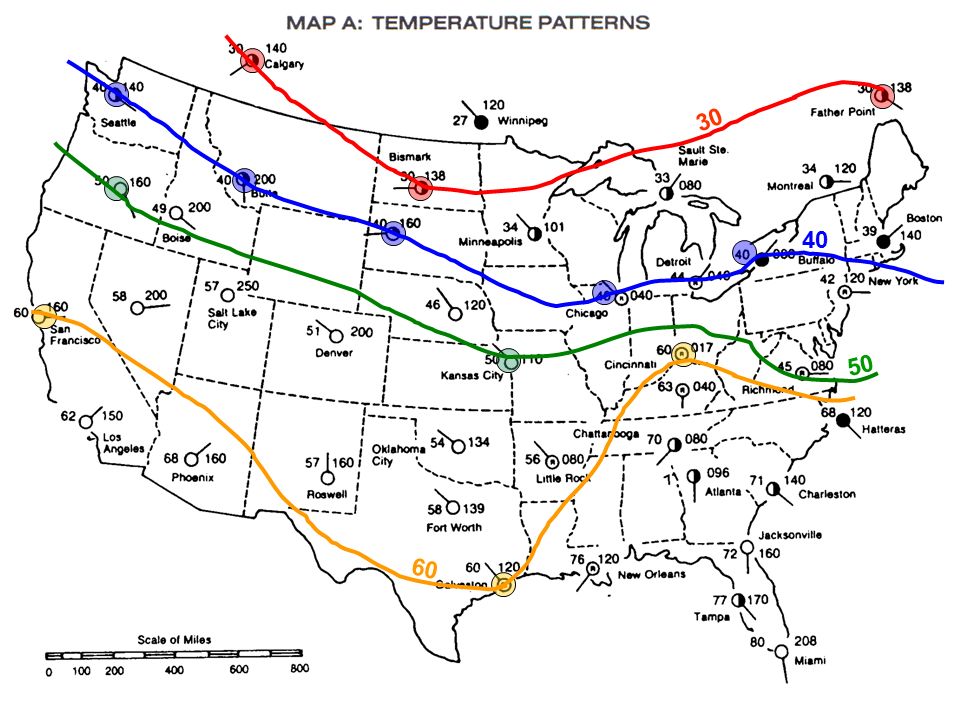
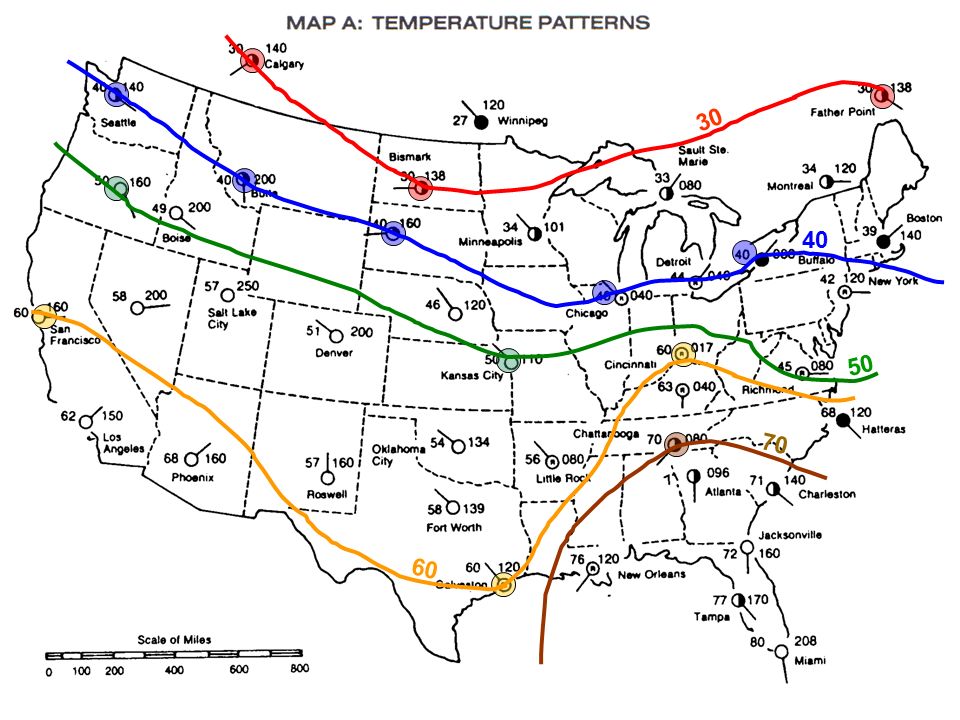
Procedure – On map A use a pencil to draw isotherms at a 10-degree interval (30, 40, 50, 60, and 70 degrees) On map A label the isotherms

4
30

5
30 40

6
30 40 50
7
30 40 50 60
8
30 40 50 70 60
9
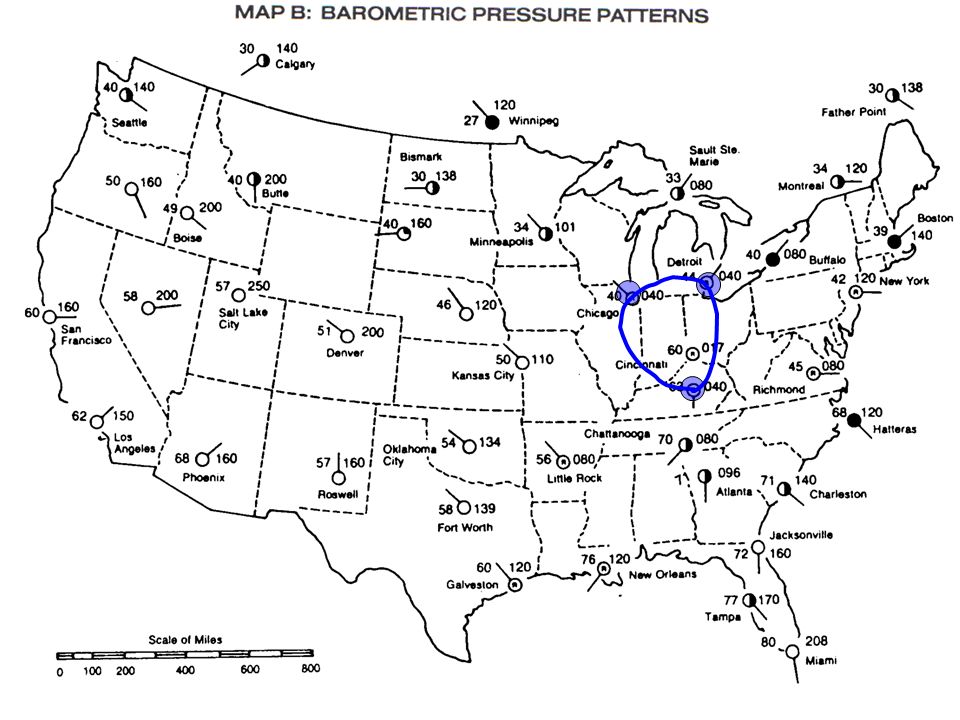
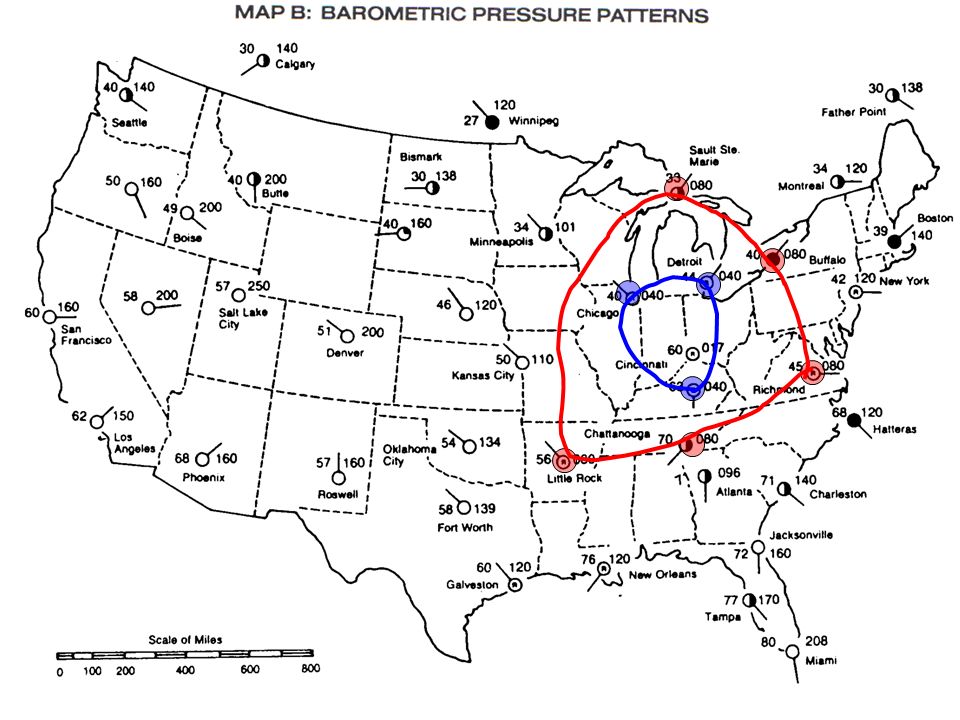
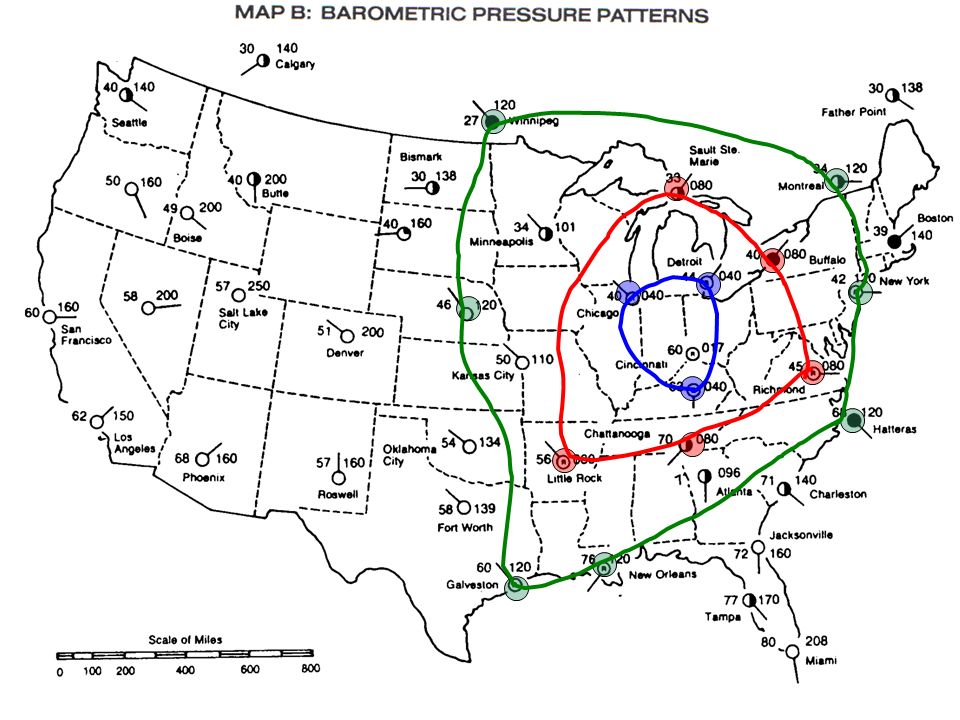
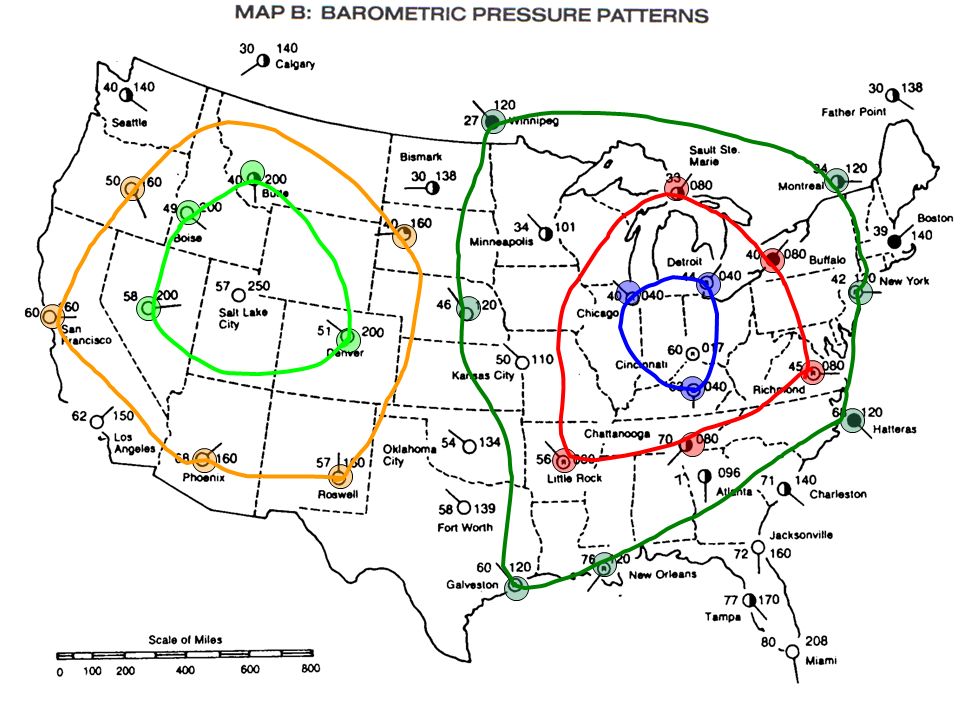
Procedure – 3. On map B use a pencil to draw isobars between points of equal atmospheric pressure. (040, 080, 120, 160, and 200) 4. On map B label the isobars 5. On map B label the high and low pressure areas

15
H L

16
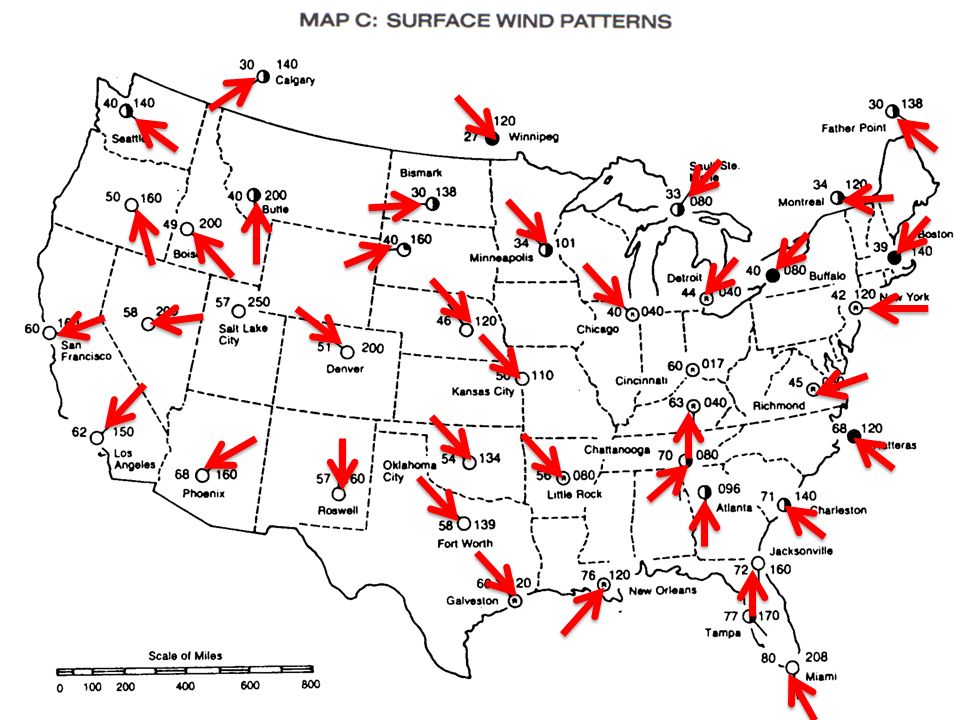
Procedure – 6. On map C use a pencil to extend the tail of the station model to show the direction each station model is blowing 7. On map C use a pen to draw larger arrows to show the general pattern of air flow

18
H L

19
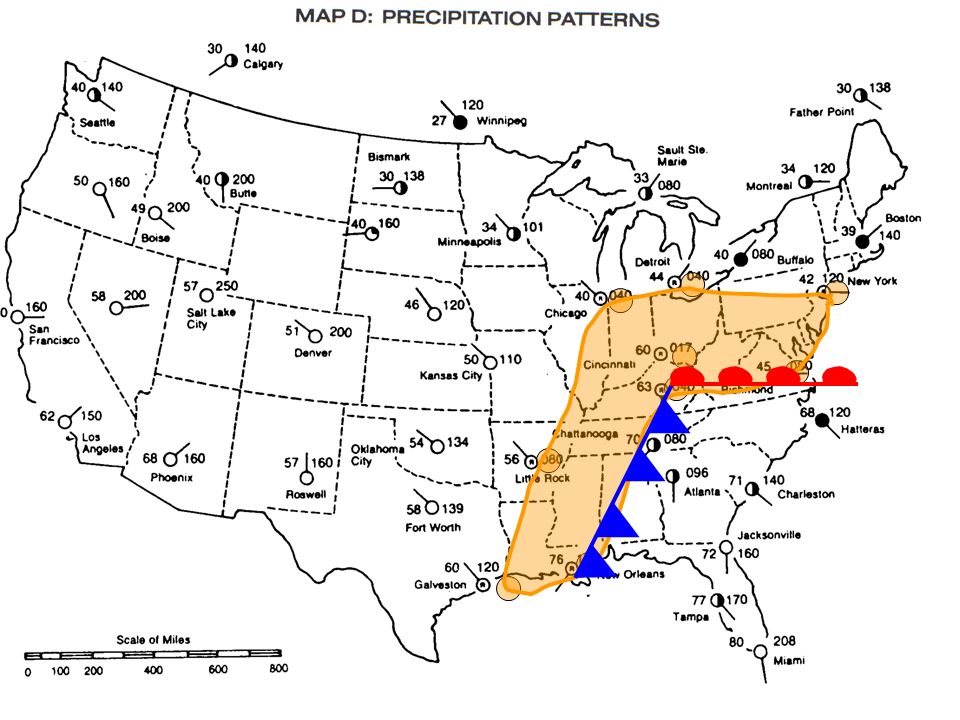
Procedure – 8. On map D the symbol “R” inside the station model indicates rain. Draw a line around this area then lightly shade it using a pencil. 9. On map D draw the symbols for a cold and warm front along the area of precipitation

22
Discussion Questions Map A
1. What is the general appearance of the isotherms on this map? __________________________________________ 2. How does the temperature change from north to south on this map? 3. Near which cities is the temperature gradient the greatest?

23
Map B 4. What is the general appearance of the isobars? __________________________________________ 5. The low pressure system is near which city? What is the lowest pressure on the map? 6. The high pressure system is near which city? What is the highest pressure on the map? 7. As you travel from Salt Lake City to Los Angeles, what change in atmospheric pressure would you observe?

24
Map C 8. What region of the country has the greatest change in wind direction? __________________________________________ 9. Describe the general wind pattern around a high and low pressure area?

25
Map D 10. With respect to the cold front, where does precipitation occur? __________________________________________ 11. With respect to the warm front, where does precipitation occur?

26
H L

Similar presentations


>")


