Download presentation
Presentation is loading. Please wait.

1
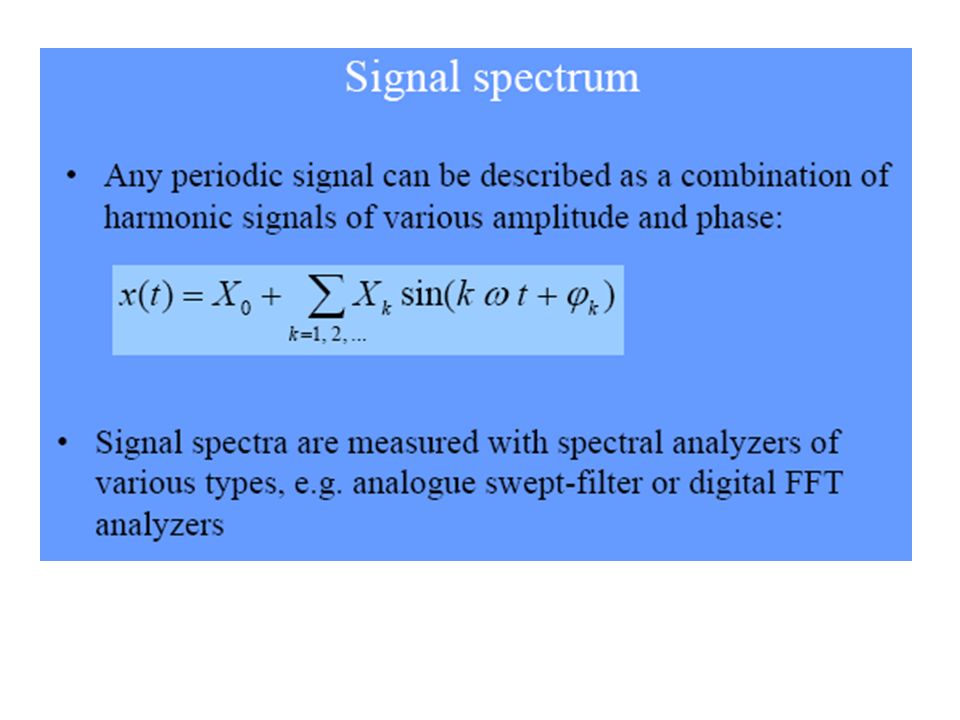
Sinyal, Power, Spectrum

2
A graph of the intensity plotted against the frequency (showing the amount of each color) is the frequency spectrum of the light. When all the visible frequencies are present in equal amounts, the effect is the "color" white, and the spectrum is a flat line. Therefore, flat- line spectrums in general are often referred to as white, whether they represent light or something else. Similarly, a source of sound can have many different frequencies mixed together. Each frequency stimulates a different length receptor in our ears. When only one length is predominantly stimulated, we hear a note. A steady hissing sound or a sudden crash stimulates all the receptors, so we say that it contains some amounts of all frequencies in our audible range. Things in our environment that we refer to as noise often comprise many different frequencies. Therefore, when the sound spectrum is flat, it is called white noise. This term carries over into other types of spectrums than sound.white noise

3
Spectrum of Fe Factors affecting successful interpreting of signals: Signal to noise ratio Data rate Bandwidth Signal Spectrum –Lack of high frequencies reduces required bandwidth –Lack of dc component allows ac coupling via transformer, providing isolation –Concentrate power in the middle of the bandwidth

4
Signal Energy A good measurement of the strength of a signal would be the area under the curve. However, this area may have a negative part. This negative part does not have less strength than a positive signal of the same size. This suggests either squaring the signal or taking its absolute value, then finding the area under that curve. It turns out that what we call the energy of a signal is the area under the squared signal. Figure 1: The energy of this signal is the shaded region. E f =∫ −∞ ∞ (|f(t) | ) 2 dt
 | ) 2 dt.")
5
Signal Power Our definition of energy seems reasonable, and it is. However, what if the signal does not decay? In this case we have infinite energy for any such signal. Does this mean that a sixty hertz sine wave feeding into your headphones is as strong as the sixty hertz sine wave coming out of your outlet? Obviously not. This is what leads us to the idea of signal power.

6
Figure 2: A simple, common signal with infinite energy. Power is a time average of energy (energy per unit time). This is useful when the energy of the signal goes to infinity.
. This is useful when the energy of the signal goes to infinity..")
7
Figure 3: We compute the energy per a specific unit of time, then allow that time to go to infinity. Pf is often called the mean-square value of f. Pf is then called the root mean squared (RMS) value of f. Energy vs. Power "Energy signals" have finite energy. "Power signals" have finite and non-zero power.
 value of f. Energy vs. Power Energy signals have finite energy. Power signals have finite and non-zero power..")
8
Problem 1 Are all energy signals also power signals? Problem 3 Are all signals either energy or power signals? Problem 2 Are all power signals also energy signals?

9
Solution 1 No. In fact, any signal with finite energy will have zero power. Solution 2 No, any signal with non-zero power will have infinite energy. Solution 3 No. Any infinite-duration, increasing-magnitude function will not be either. (eg f(t) =t is neither)
 =t is neither).")
Similar presentations


>")
 ● Standard Definitions ● Computing the DFT and FFT ● Sine and cosine wave multiplication.>")


