Download presentation
Presentation is loading. Please wait.

1
Performance of wind energy conversion systems

2
For the efficient planning and successful implementation of any wind power project, an understanding on the performance of the Wind Energy Conversion System (WECS), at the proposed site, is essential.
, at the proposed site, is essential.")
3
The major factors affecting the power produced by a WECS are (a) the strength of the wind spectra prevailing at the site and its availability to the turbine (b) the aerodynamic efficiency of the rotor in converting the power available in the wind to mechanical shaft power and (c) the efficiencies in manipulating, transmitting and transforming this power into the desired form. Hence, assessment of the performance of a WECS is rather a complex process.

5
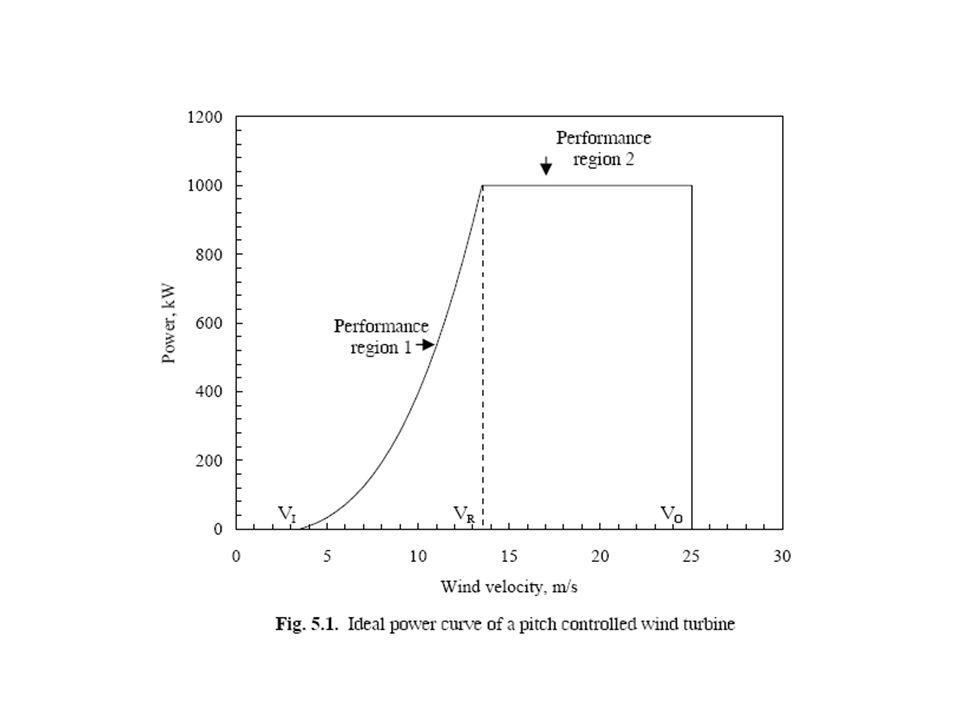
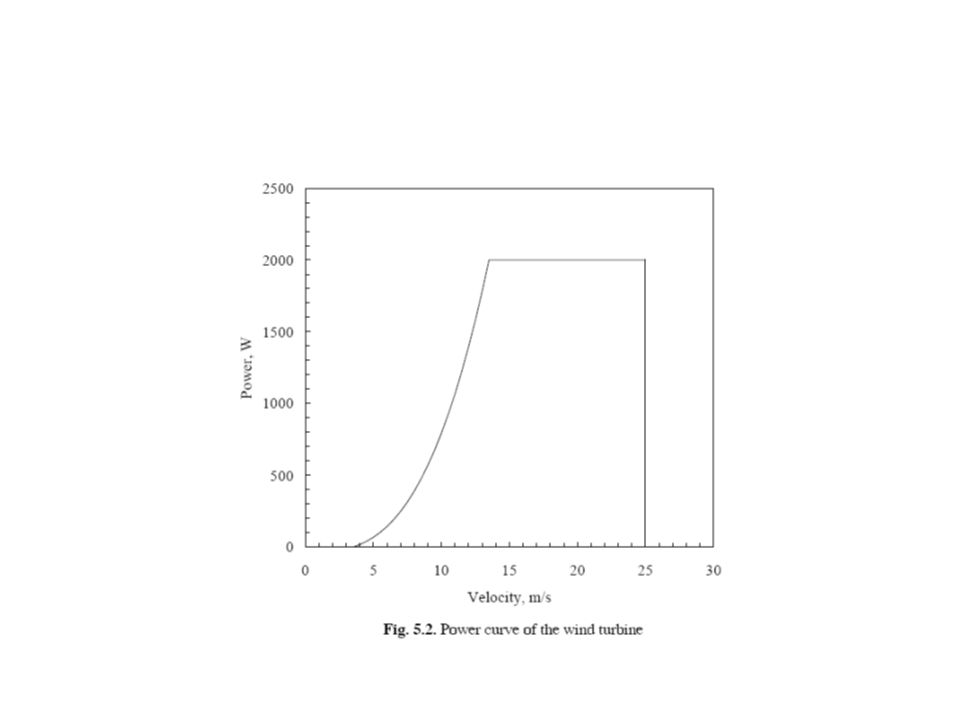
Fig. 5.1 shows the typical power curve of a pitch controlled wind turbine. The rated power of the turbine is 1 MW. The given curve is a theoretical one and in practice we may observe the velocity power variation in a rather scattered pattern.

6
We can see that the important characteristic speeds of the turbine are its cut-in velocity (V I ), rated velocity (V R ) and the cut-out velocity (V O ).
, rated velocity (V R ) and the cut-out velocity (V O ).")
7
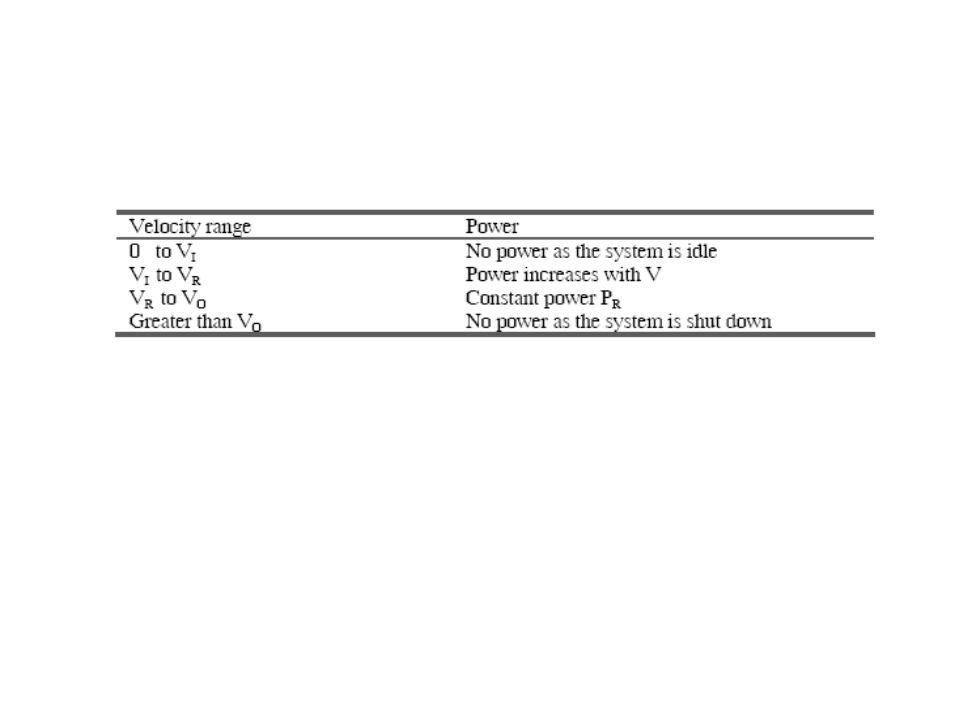
The cut-in velocity of a turbine is the minimum wind velocity at which the system begins to produce power. It should not be confused with the start-up speed at which the rotor starts its rotation. The cut- in velocity varies from turbine to turbine, depending on its design features. However, in general, most of the commercial wind turbines cut-in at velocities between 3 to 5 m/s.

8
Due to technical and economical reasons, the wind turbine is designed to produce constant power - termed as the rated power (P R ) - beyond its rated velocity. Thus, the rated velocity of a turbine is the lowest wind velocity corresponding to its rated power. Usually the system efficiency is maximum at VR. From V I, to V R, the power generated by the turbine increases with the wind velocity.

9
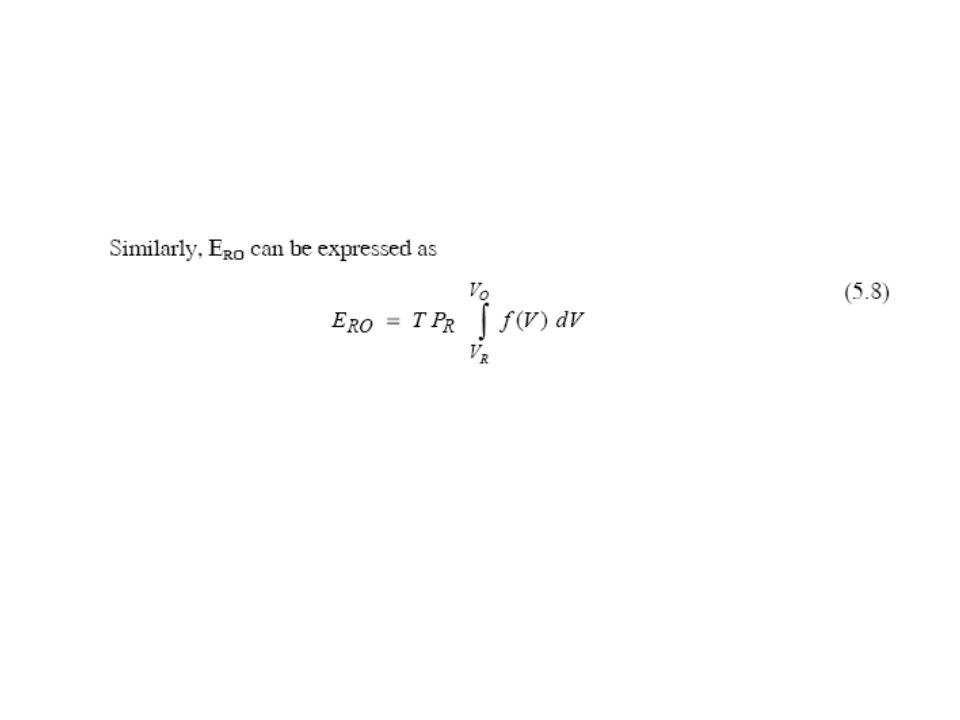
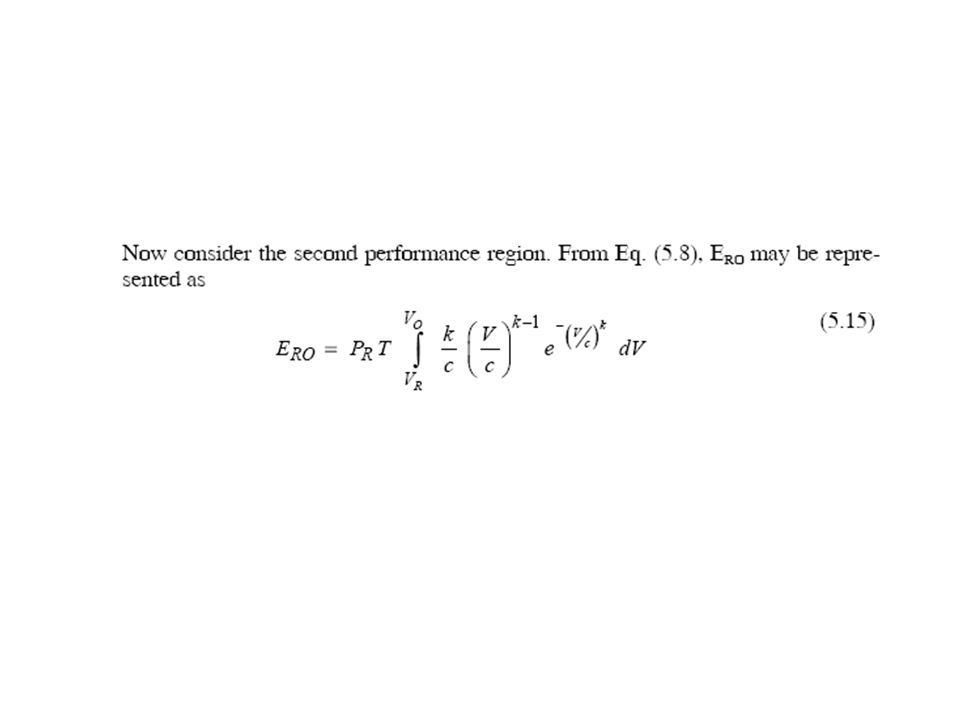
Between V R and V O, the turbine is restricted to produce constant power P R corresponding to V R, irrespective of the changes in velocity. This power regulation is for better system control and safety. Hence P R is the theoretical maximum power expected from the turbine. At wind velocities higher than V O, the machine is completely shut down to protect the rotor and drive trains from damage due to excessive loading. Some times V O is also termed as the furling velocity, as in the earlier sail type machines the canvas was rolled upto protect the mill from strong winds.

11
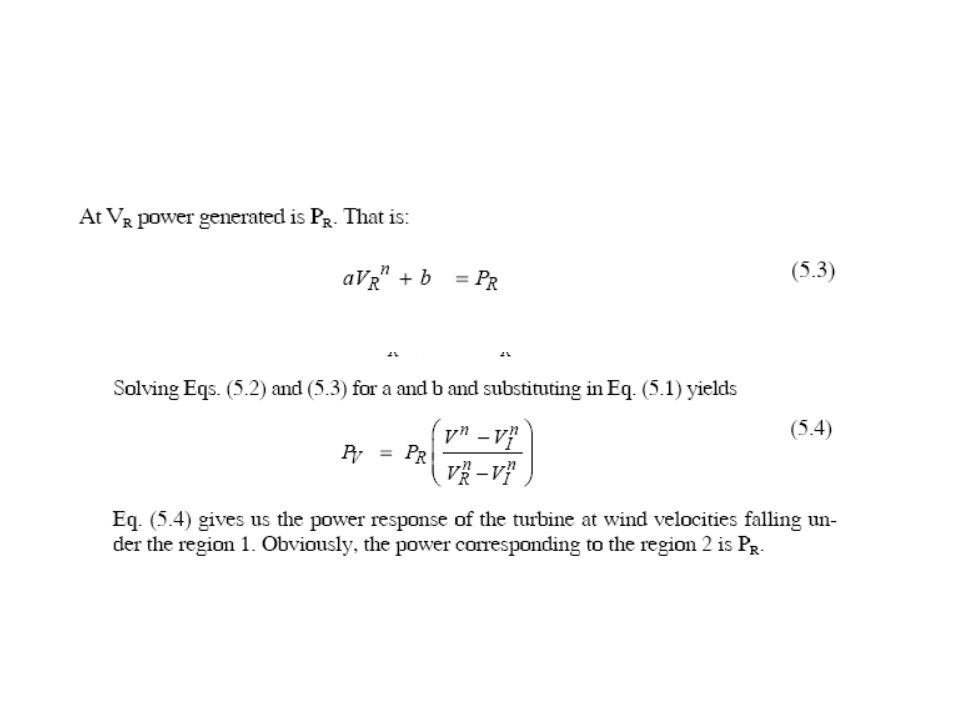
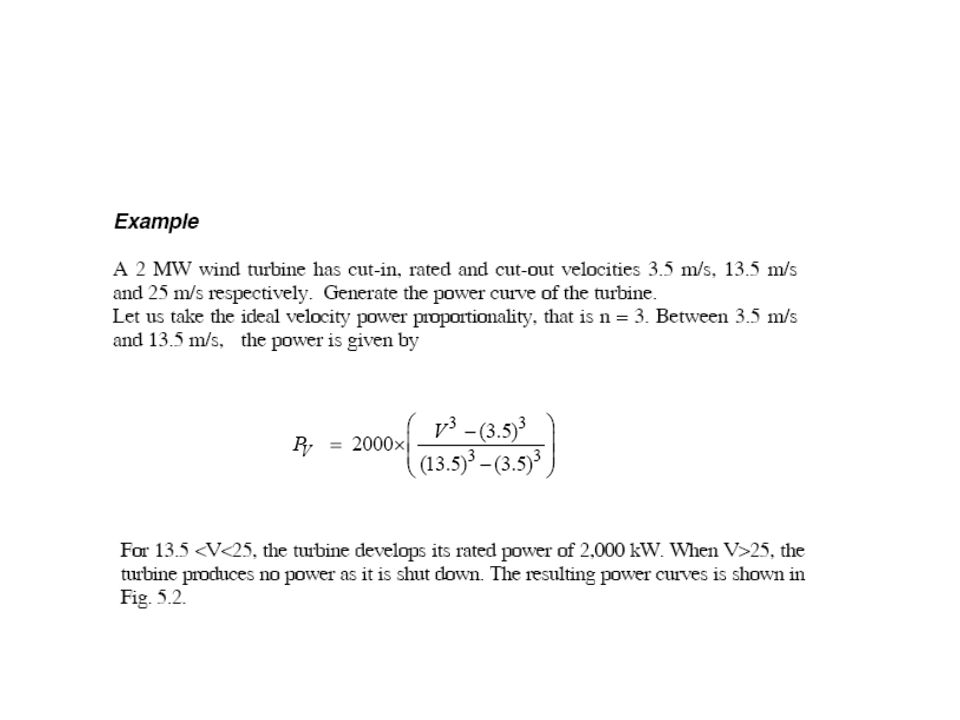
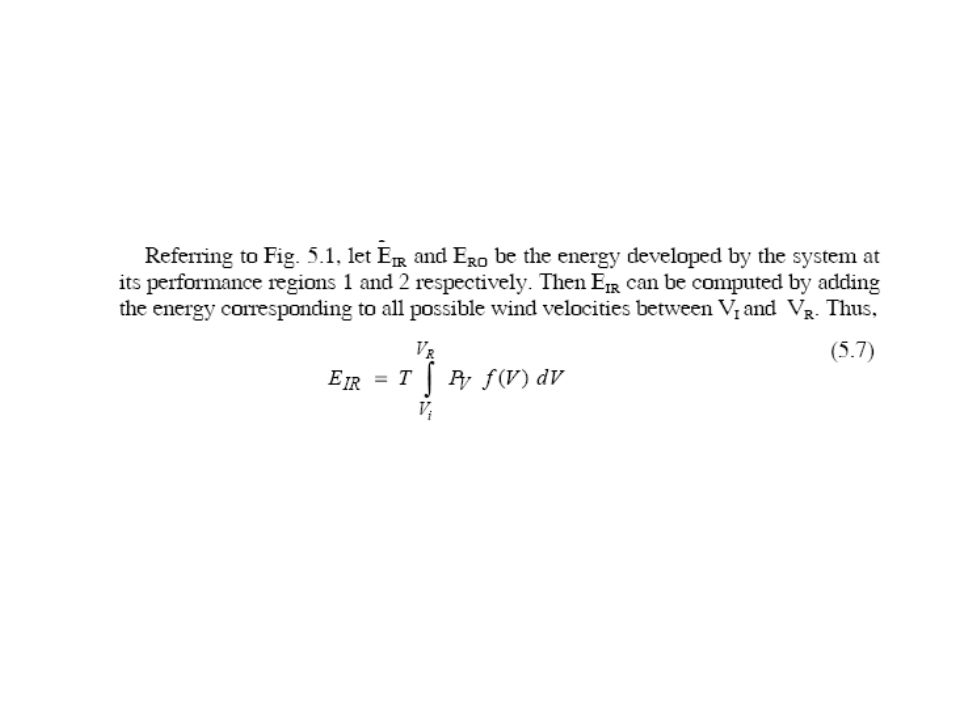
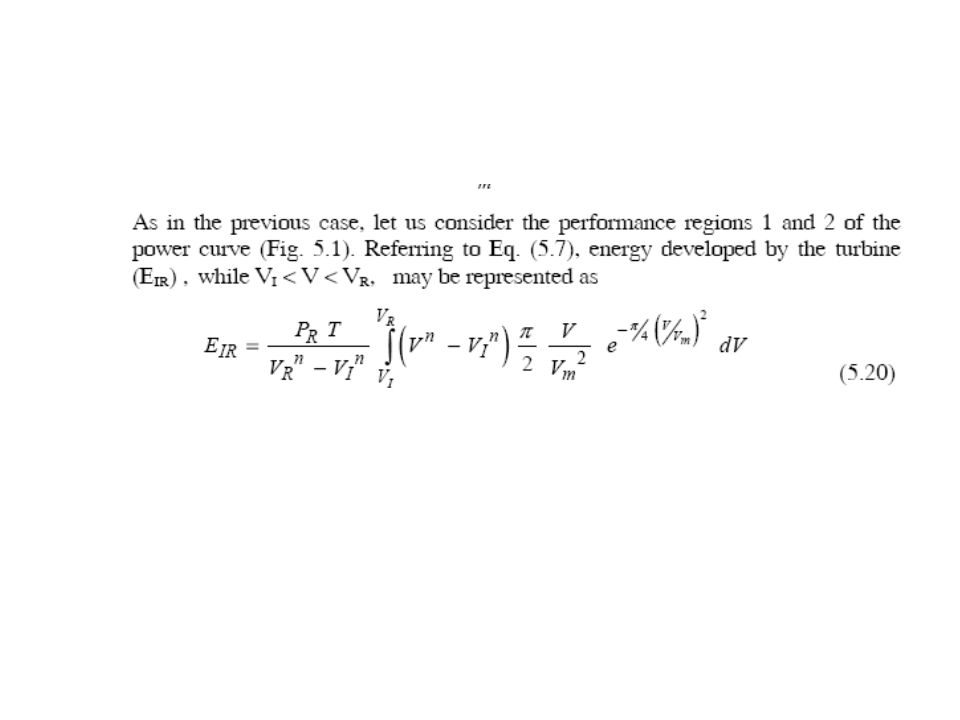
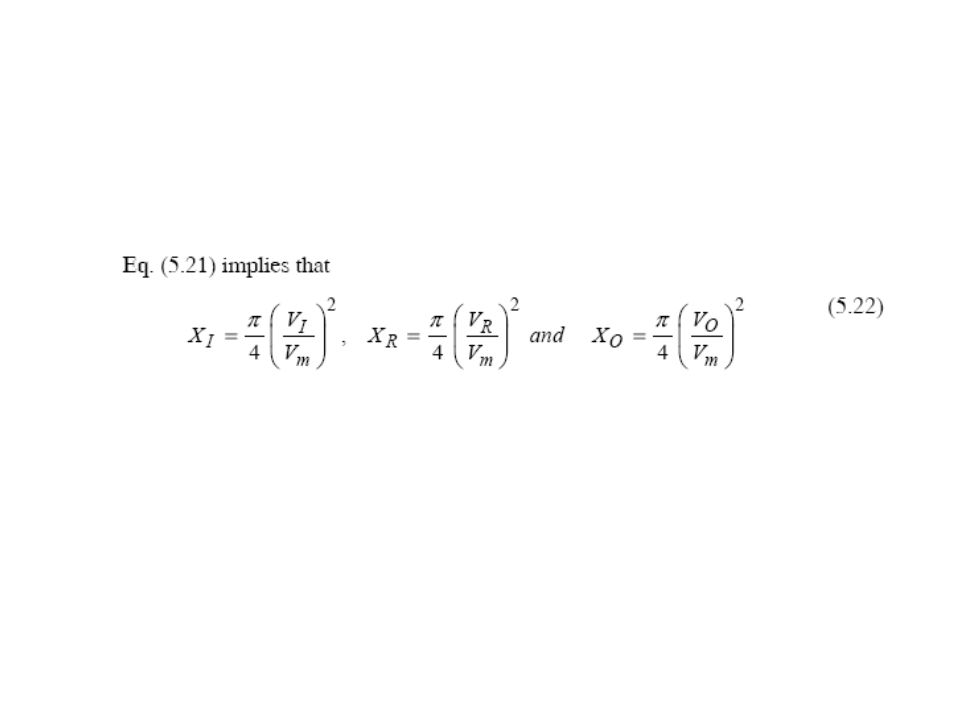
The power produced by the system is effectively derived from performance regions corresponding to V I to V R and V R to V O. Let us name these as region 1 and 2. The velocity-power relationship in the region 1 can be expressed inthe general form

12
where a and b are constants and n is the velocity-power proportionality. Now consider the performance of the system at V I and V R. At V I, the power developed by the turbine is zero. Thus

16
The factors influencing the energy produced by a WECS at a given location over a period are: (1) the power response of the turbine to different wind velocities (2) the strength of the prevailing wind regime and (3) the distribution of wind velocity within the regime.
 the power response of the turbine to different wind velocities (2) the strength of the prevailing wind regime and (3) the distribution of wind velocity within the regime.")
17
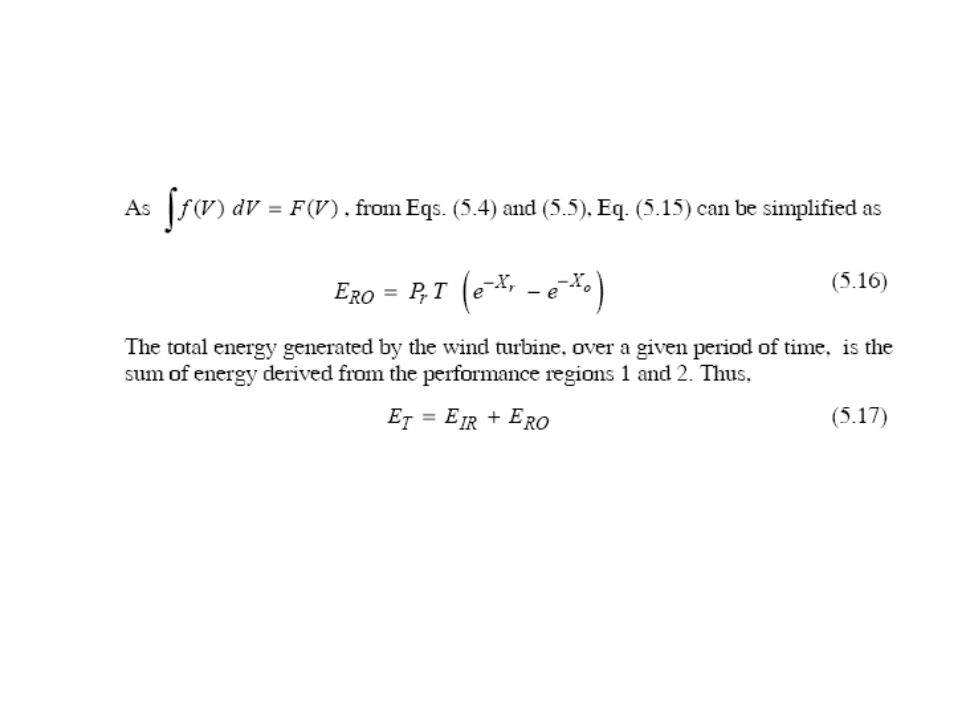
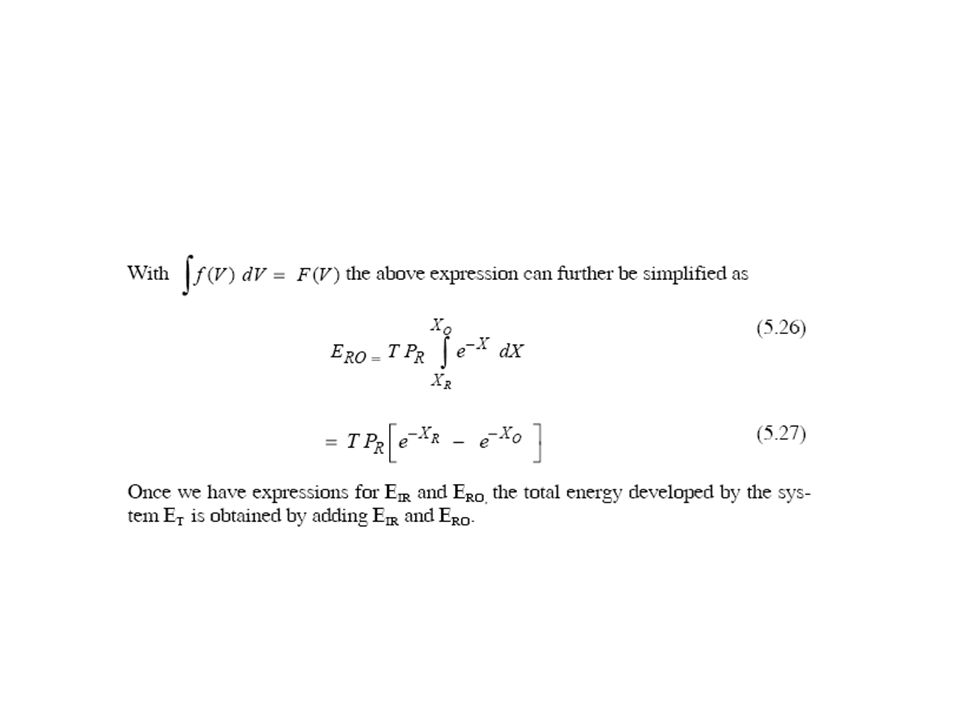
Energy corresponding to a certain wind velocity V is the product of the power developed by the turbine at V and the time for which this velocity V prevails at the site. The total energy generated by the turbine over a period can be computed by adding up the energy corresponding to all possible wind speeds in the regime, at which the system is operational.

18
Hence, along with the power characteristics of the turbine, the probability density corresponding to different wind speeds also comes into our energy calculations.

19
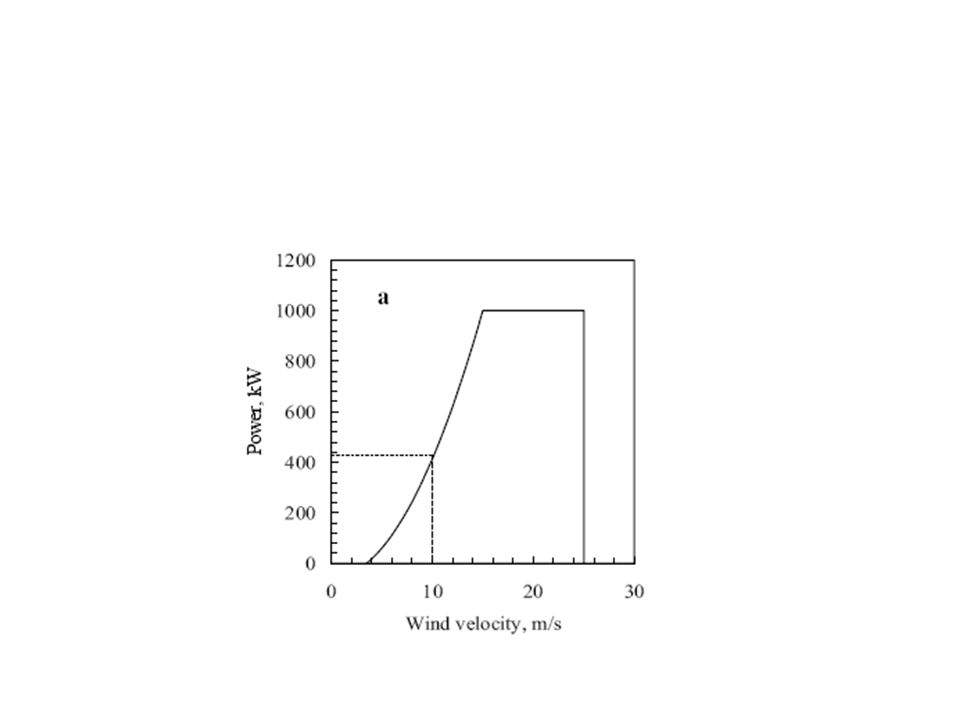
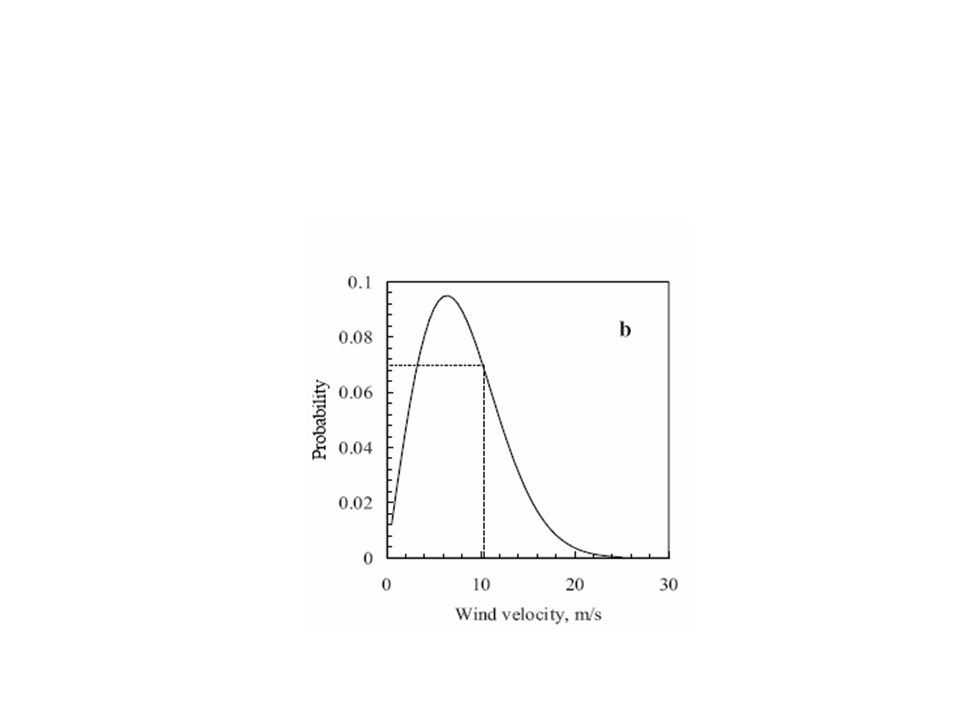
This is expressed graphically in the following figure. In the figure, curve (a) represents thepower curve of a commercial I MW turbine with 3.5 m/s cut-in, 15 m/s rated and25 m/s cut-out velocities. Curve (b) represents the probability density function at a site with 8 m/s mean wind speed, assuming the Rayleigh distribution. The energy corresponding to different wind velocities are plotted in curve (c).
 represents thepower curve of a commercial I MW turbine with 3.5 m/s cut-in, 15 m/s rated and25 m/s cut-out velocities. Curve (b) represents the probability density function at a site with 8 m/s mean wind speed, assuming the Rayleigh distribution. The energy corresponding to different wind velocities are plotted in curve (c)..")
23
To find out the energy contributed by a wind speed of 10 m/s, the power and the probability density corresponding to 10 m/s are located from the curves (a) and (b). The energy corresponding to this velocity is indicated in the curve (c), which is basically the product of the power and the probability density for 10 m/s. Total energy available from this turbine at this site, over a period, can be estimated by integrating curve (c) within the limits of the cut-in and cut-out velocities and multiplying it with the time factor.
, which is basically the product of the power and the probability density for 10 m/s. Total energy available from this turbine at this site, over a period, can be estimated by integrating curve (c) within the limits of the cut-in and cut-out velocities and multiplying it with the time factor..")
24
Weibul based approach

33
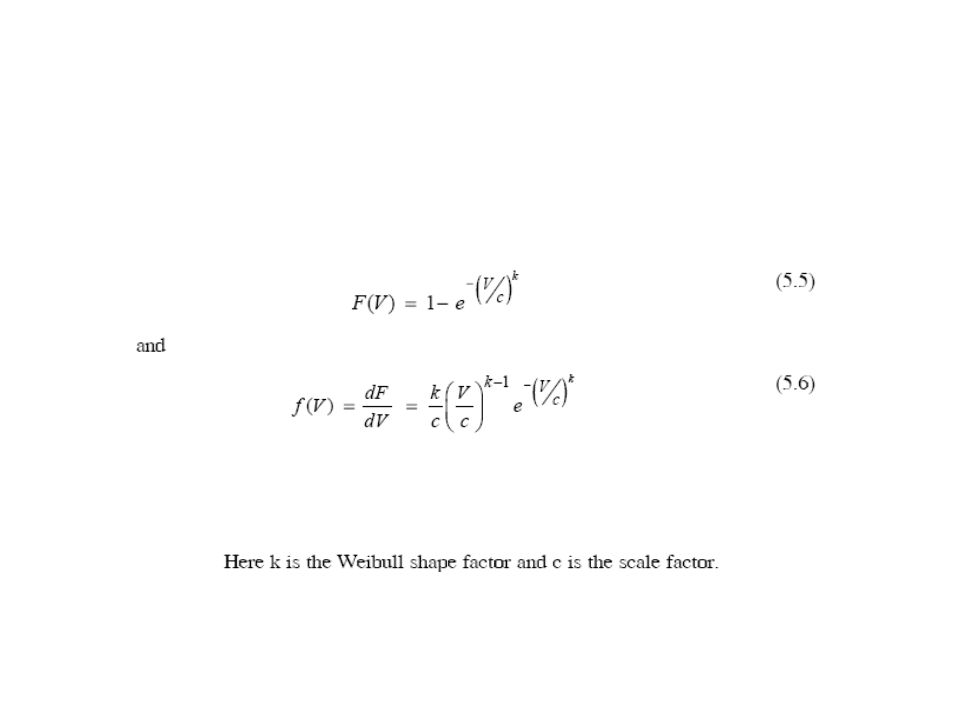
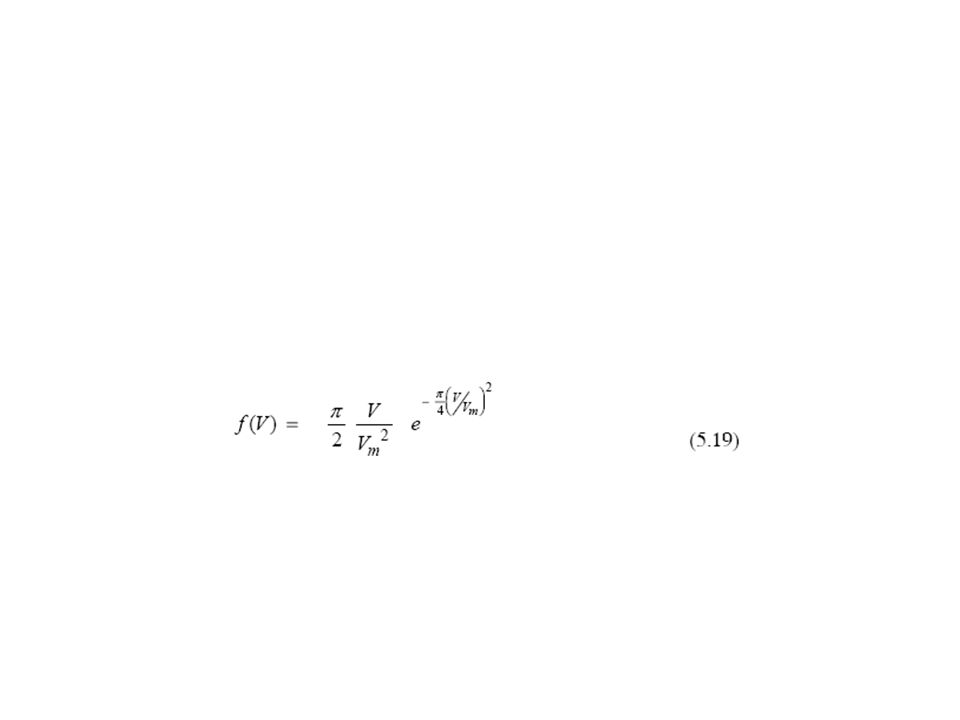
Rayleigh based approach Rayleigh distribution is a simplified case of the Weibull distribution which is derived by assuming the shape factor as 2.

34
Owing to its simplicity, this distribution is widely used for wind energy modeling. Under the Rayleigh based approach, the cumulative distribution and probability density functions of wind velocity are given by

43
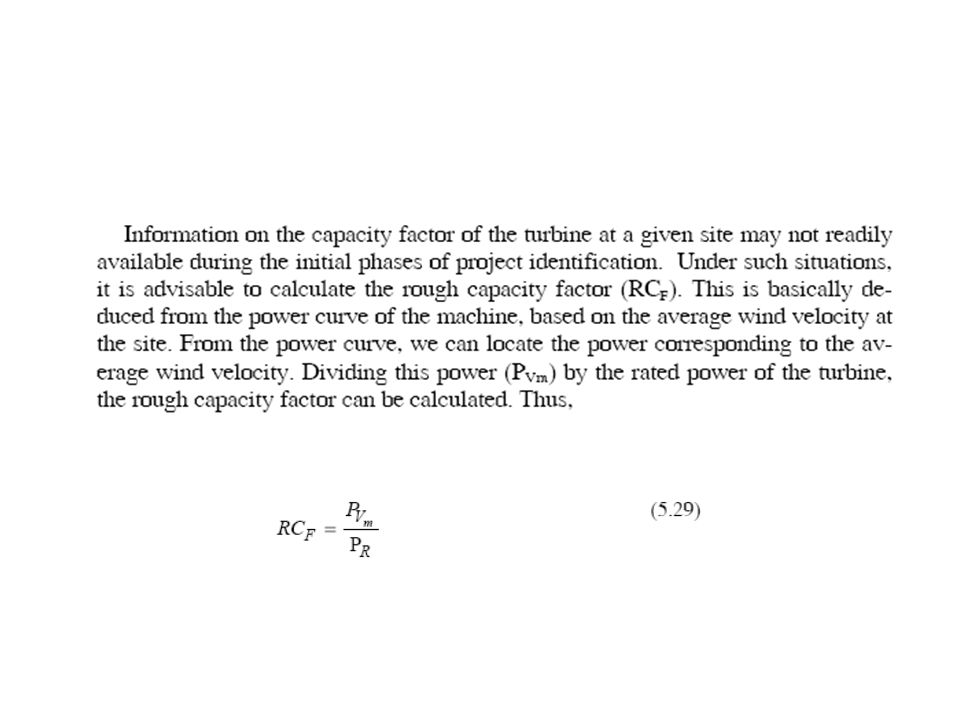
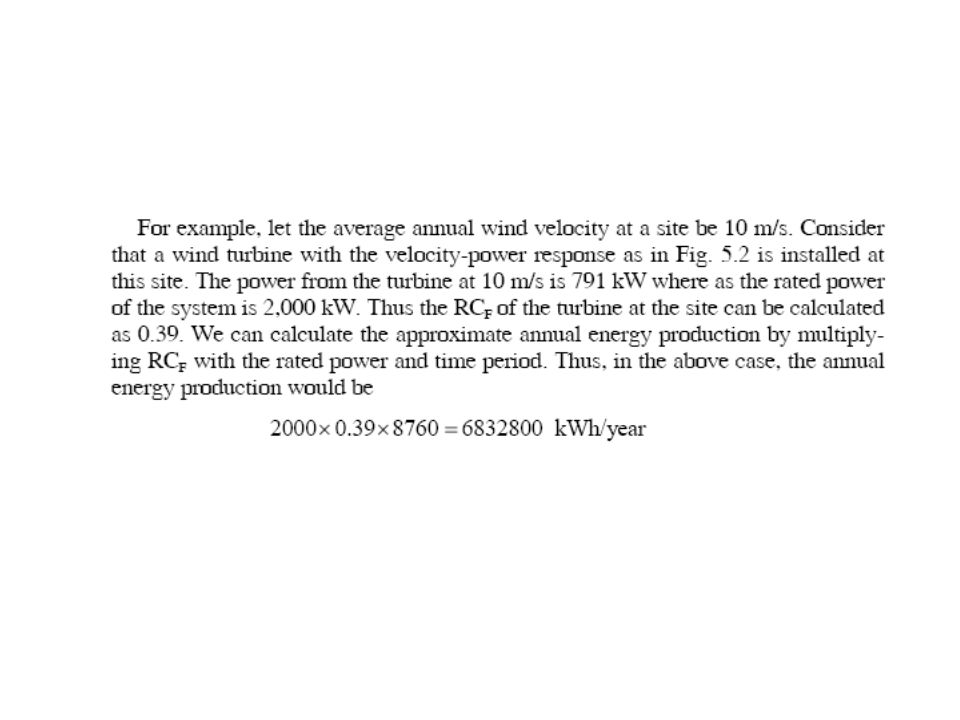
Capacity factor

Similar presentations