Download presentation
Presentation is loading. Please wait.

1
Hypothesis Testing with TWO Samples

2
Section 8.1

3
2 samples are independent if the sample selected from one population is not related to the sample selected from the 2 nd population. 2 samples are dependent if each member of one sample corresponds to a member of the other sample. (a.k.a. Paired or Matched samples)
.")
4
Sample 1: the SAT scores of 44 high school students. Sample 2: the SAT scores of the same 44 high school students after taking an SAT preparation course. Sample 1: the IQ scores of 60 females Sample 2: The IQ scores of 60 males

5
3 ways the NULL hypothesis can be written: µ 1 = µ 2 µ 1 µ 2 The samples must be randomly selected, independent, and each sample size must be at least 30 If n is not > 30, then each population must have a normal distribution with σ known.

6
1. State the hypotheses 2. Specify level of significance, α 3. Determine the critical value(s) 4. Shade the rejection region(s) 5. Find the test statistic, z (new formula) 6. Make decision to reject or not reject H 0 7. Interpret the decision in context
 4. Shade the rejection region(s) 5. Find the test statistic, z (new formula) 6. Make decision to reject or not reject H 0 7. Interpret the decision in context.")
8

9
16. To compare the amounts spent in the first three months by clients of two meal- replacement diets, a researcher randomly selects 20 clients of each diet. The mean amount spent for Diet A is $643. Assume the population standard deviation is $89. The mean amount spent for Diet B is $588. Assume the population standard deviation is $75. At α = 0.01, can the researcher support the claim that the mean amount spent in the first three months by clients of Diet A is greater than the mean amount spent in the first three months of Diet B?

10
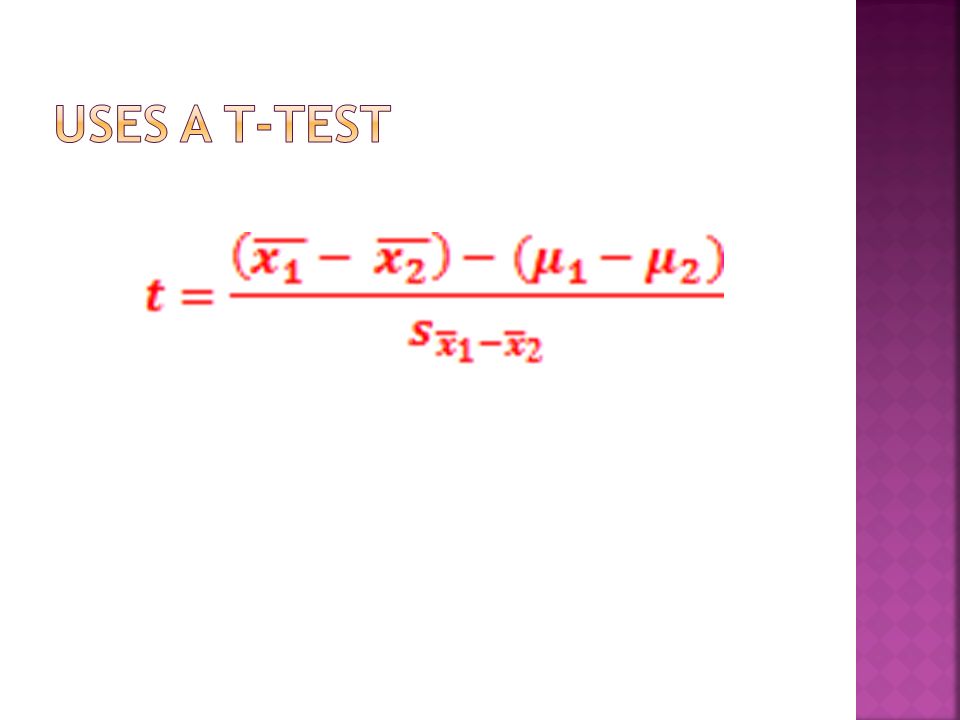
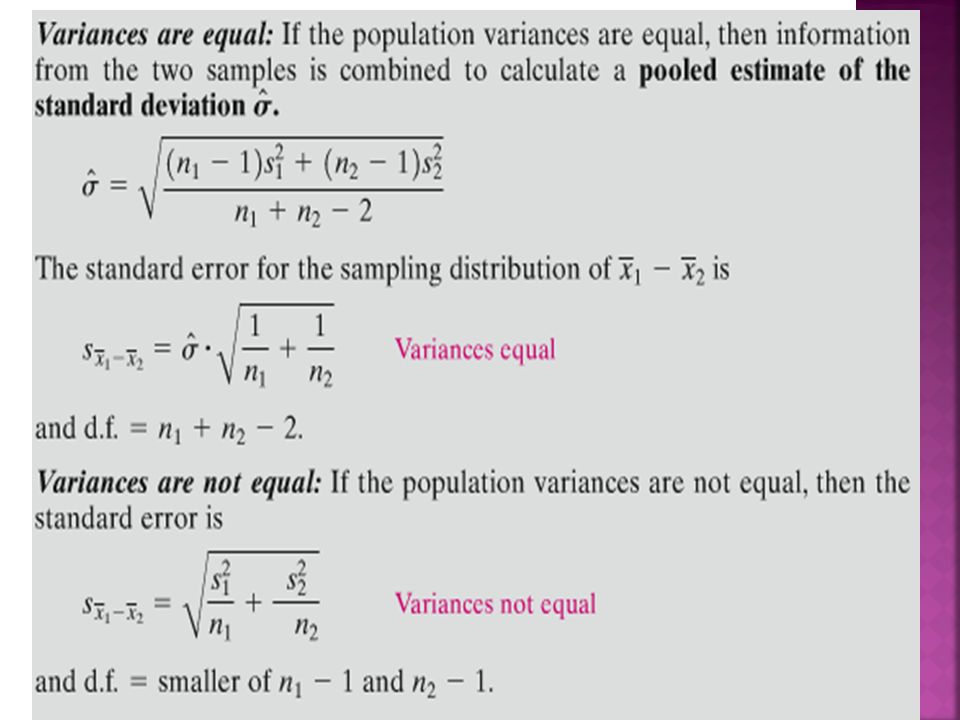
Section 8.2

13

14
14. A magazine claims that the mean amount spent by a customer at Burger World is greater than the mean amount spent by a customer at Fry World. The results for samples of customer transactions for the 2 fast food restaurants are shown below. At α = 0.05, can you support the magazine’s claim? Assume the population variances are equal. Burger StopFry World s 1 = $0.89s 2 = $0.79 n 1 = 22n 2 = 30

Similar presentations

>")
>")

>")

>")


 8.2 Testing the.>")
 QSCI 381 – Lecture 32 (Larson and Farber, Sects 8.3 – 8.4)>")

>")

