Download presentation
Presentation is loading. Please wait.

1
Homology Modeling 原理、流程,還有如何用該工具去預測三級結構 Lu Chih-Hao 1 1

2
Why study protein structure?
Proteins play crucial functional roles in all biological processes: enzymatic catalysis, signaling messengers … Function depends on 3D structure. Easy to obtain protein sequences, difficult to determine structure. 1. 要知道結構的目的,最終就是要知道protein 的功能。 2. 蛋白質的功能是由結構所決定的。 3. 能得到一個正確的蛋白質結構是非常重要的。 4.蛋白質三維結構可以用來指引生物實驗。 此一個方法可以應用在蛋白質突變研究 (mutation)、活性位置研究(active site) 與 藥物設計等。能夠減少在實驗上、製藥 上所須的時間。 只有序列的資訊有時很難得知他的function 2 2
、活性位置研究(active site) 與. 藥物設計等。能夠減少在實驗上、製藥. 上所須的時間。 只有序列的資訊有時很難得知他的function")
3
Where find the data? Protein Data Bank (PDB) http://www.rcsb.org/pdb/
> ~100,000 structures of proteins Text file contain: coordinates for each heavy atom from the first residue to the last X Y Z 1. 蛋白質的結構,主要儲存在protein data bank 的 databases 裡,簡稱PDB。 2. 儲存的格式。 3. 記錄每個原子三度空間的座標。 結構預測時,很多時候都必須要參考到現有已知的結構。 3 3

4
PDB Statistics 4

5
TIM barrel 5

6
How to determine the protein structure?
By experimentation X-Ray NMR (nuclear magnetic resonance spectroscopy) Sequence-Structure gap 1. 在實驗上,決定蛋白質結構有兩種。 2. 所以目前很多在這方面的研究,想用prediction的方法來填補gap的區域。 3. 那是不是 No structure => No GO? 利用X-光線繞射的特性,對已經結晶的蛋白質進行繞射實驗,然後再將所得到的數據加以分析,就可以得到結構。 利用核磁共振現象得到蛋白質的結構。並不是所有原子核都能產生核磁共振的現象。 6 6
 Sequence-Structure gap. 1. 在實驗上,決定蛋白質結構有兩種。 2. 所以目前很多在這方面的研究,想用prediction的方法來填補gap的區域。 3. 那是不是 No structure => No GO 利用X-光線繞射的特性,對已經結晶的蛋白質進行繞射實驗,然後再將所得到的數據加以分析,就可以得到結構。 利用核磁共振現象得到蛋白質的結構。並不是所有原子核都能產生核磁共振的現象。")
7
Protein Structure Prediction
The primary sequence already contain all the information necessary to define 3D structure. The 3D protein structure can be predicted according to three main categories of methods (Rost & O’Donoghue, 1997): (1) homology modeling; (2) fold recognition (threading); (3) ab initio techniques. Homology modeling is currently the most accurate method to predict protein 3D structure (Tramontano, 1998). 1. 那什麼時候要用哪一個方法呢?這裡我做了一個簡單的圖表來做說明。 7 7
: (1) homology modeling; (2) fold recognition (threading); (3) ab initio techniques. Homology modeling is currently the most accurate method to predict protein 3D structure (Tramontano, 1998). 1. 那什麼時候要用哪一個方法呢?這裡我做了一個簡單的圖表來做說明。")
8
Protein Structure Prediction
Sequence Sequence Homology To known fold <30% >30% Homology Modeling Threading 1. 基本上用sequence identity 來做區別。 2. Comparative和Threading都需要template 3. Ab inito 直接由氨基酸的物理、化學特性(熱力學原理)來預測結構,適合較小的protein。 Yes Match Found? No Model Ab initio 8 8
來預測結構,適合較小的protein。 Yes. Match Found No. Model. Ab initio")
9
Sequence similarity implies structural similarity?
2 4 6 8 1 5 i d e n t y Number of residues aligned Percentage sequence identity/similarity (B.Rost, Columbia, NewYork) Sequence identity implies structural similarity . Safe zone 1. 30%只是一個大概的標準。 2. 會依照aligned的residues而有些微的變化。這是統計出來的結果。 3. 當sequence aligned的很長時,identity就可以不用到30%。 9 9
 Sequence identity implies structural similarity. . Safe zone %只是一個大概的標準。 2. 會依照aligned的residues而有些微的變化。這是統計出來的結果。 3. 當sequence aligned的很長時,identity就可以不用到30%。")
10
Homology Modeling Basis
Structure is much more conserved than sequence during evolution Limited applicability A large number of proteins and ORFs have no similarity to proteins with known structure Structure is conserved much longer than sequence in evolution. 同源模擬法是根據同源蛋白質三級結構的保留性超過蛋白質序列的理論,通常在 蛋白質序列上稍微的改變其三級結構亦改變很小。 10 10

11
What is Homology Modeling?
Target Template KVFGRCELAAAMKRHGLDNYRGYSLGNWVCAAKFESNFNTQATNRNTDGSTDYGILQINSRWWCNDGRTPGSRNLCNIPCSALLSSDITASVNCAKKIVSDGNGMNAWVAWRNRCKGTDVQAWIRGCRL Share Similar Sequence Homologous ? KQFTKCELSQNLYDIDGYGRIALPELICTMFHTSGYDTQAIVENDESTEYGLFQISNALWCKSSQSPQSRNICDITCDKFLDDDITDDIMCAKKILDIKGIDYWIAHKALCTEKLEQWLCEKE 8lyz 1alc 1. 接下來就講到我們今天的主題,Homology Modeling。 2. 利用template所提供的資訊,來預測target可能的三級結構(template必須是target的homology)。 3. 用圖解的方式加以說明。 4. Identity越高,準確度越高。 Use as template 11 11
。 3. 用圖解的方式加以說明。 4. Identity越高,準確度越高。 Use as template")
12
Structure prediction by homology modeling
Step 1 Step 2 Step 3 1. 剛剛講完了概念,現在要講其流程。 2. 兩條序列必須進行比對,找出相對應的位置。 Step 4 12 12

13
Homology detection and template selection
To detect the fold of a probe sequence from a library of known target fold. The three type of sequence based methods: Pair-wise sequence-sequence comparison FASTA, BLAST Sequence profile comparison PSI-BLAST, IMPALA, HMMER, SAM Profile-profile comparison prof_sim, COMPASS 由Databases中去尋找一個或多個structure來當作template,當然與target的結構越像越好。 13 13

14
Sequence-Sequence comparison
T BLAST, FASTA, SSEARCH 14

15
Profile-Sequence comparison
T PSI-BLAST 15

16
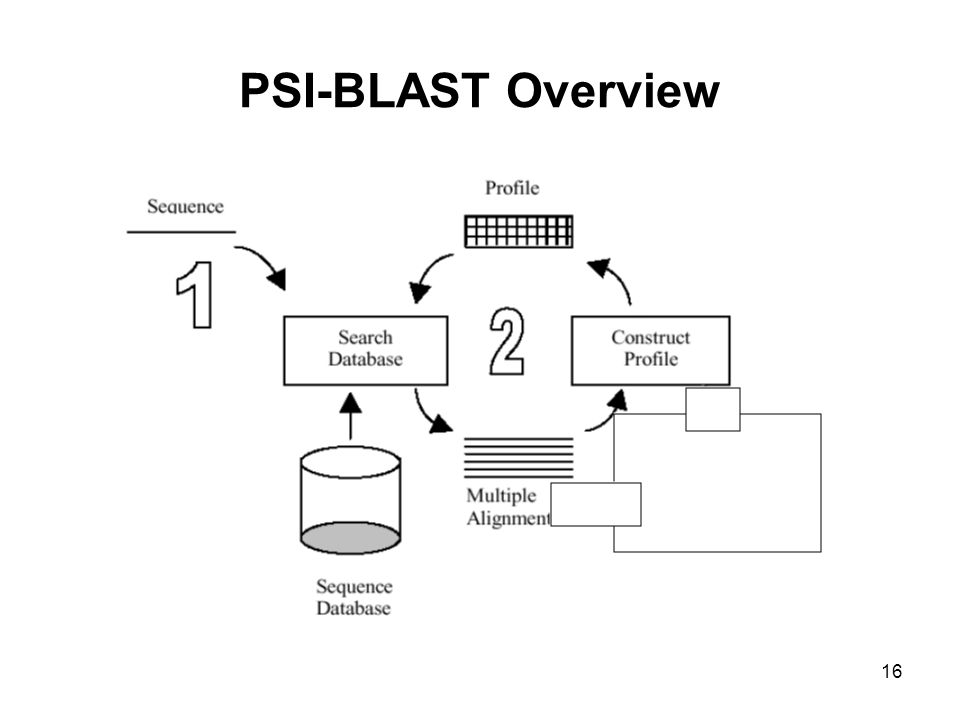
PSI-BLAST Overview 1. 說明PSI-BLAST是如何去產生profile,及如何用profile去收尋target的homology。 2. 重複的去收尋Database。 3. 比較遙遠的Homology的關係。 16 16
17
Sequence-Profile comparison
T RPS-BLAST, IMPALA, HMMER, SAM 17

18
Profile-Profile comparison
Q T prof_sim, COMPASS 18

19
The importance of the sequence alignment
Method_1 1lmb3 <-> 1pou shift = σ = 39.62 LEDARRLKAIYEKKKNELGLSQESVADKMGMGQSGVGALFNGINALNAYNAALLAKILKVSVEEFSPSIAREIYEMYEA HHHHHHHHHHHHHHHHHCCCChhhhhhhhccchhhhhhhhccccccchhhhhhhhhhhccchhhcchhhhhhhhhhhhh ||||||||||||||||||||| X XXXXXXXXXXXX XXXXXXXX HHHHHHHHHHHHHHHHHHCCC cchhhhhhhhhcccccc---chhhhhhhcccccccchhhhhhhhhhhhh LEELEQFAKTFKQRRIKLGFT QGDVGLAMGKLYGNDFS---QTTISRFEALNLSFKNMCKLKPLLEKWLN The quality of the sequence alignment is of crucial importance. Misplaced gaps, representing insertions or deletions, will cause residues to be misplaced in space. Careful inspection and adjustment on alignment may improve the quality of the modeling. 結構模擬是依據alignment的結果來進行的。 有shift,分別對應到結構的兩個位置。 SCR; structure conserved region SVR; structure variable region Method_2 1lmb3 <-> 1pou Shift = σ = 60.78 LEDARRLKAIYEKKKNELGLS----QESVADKMG--MGQSGVGALFN-GINALNAYNAALLAKILKVSVEEFS HHHHHHHHHHHHHHHHHCCCC----hhhhhhhhc--cCHHHHHHHHC-cccccchhhhhhhhhhhccchhhcc ||||||||||||||||||||| |||||||||| HHHHHHHHHHHHHHHHHHCCCcchhhhhhhhhcccccCCHHHHHHHCccccccchhhhhhhhhhh---hhhcc LEELEQFAKTFKQRRIKLGFTQGDVGLAMGKLYGNDFSQTTISRFEALNLSFKNMCKLKPLLEKW---LNDAE 19 19

20
Backbone generation Rigid-body assembly Building model core 20
Generate the backbone coordinates from the template for the aligned regions. Building model core 20 20

21
SVR通常都是Loop的位置 21 21

22
Construction of loops might be done by:
Ab initio methods - without any prior knowledge. This is done by empirical scoring functions that check large number of conformations and evaluates each of them. 1. 由計算能量的方式,選出最可能的conformation,適合較小的Loop。 Wedemeyer, Scheraga J. Comput. Chem. 20, (1999) 22 22 14
")
23
data clustered library Construction of loops might be done by:
Using database of loops which appear in known structures. The loops could be categorized by their length or sequence data clustered library 23

24
and correct end-to-end distances
挑適合的Loop來填補這個區域 Scan database and search protein fragments with correct number of residues and correct end-to-end distances 24 24

25
25 25 15
26
26 26 16

27
Loop Modeling: A database approach
Method breaks down for loops larger than 9 cRMS (Ǻ) Limit in 9 residues 一般說來,環狀結構的長度若是超過9個胺基酸,則困難度增加及準確性降低。 Loop length 27 27
 Limit in 9 residues. 一般說來,環狀結構的長度若是超過9個胺基酸,則困難度增加及準確性降低。 Loop length")
28
Predicted model with long loop
Target: 2bj7A Predicted model with long loop Without loop GDT_TS = 45.96 GDT_TS = 60.48 28

29
29 1. :此一資料庫儲存已知結構側鏈的可能構形,包含轉動子的 觀察頻率或預期頻率,每一種側鏈的構形與主鏈的二面角或與鄰近的胺基酸序列相
關連(correlations),這種顯著的相關連是在側鏈二面角機率(χ1,χ2 dihedral angle probabilities)和主鏈二面角估計值(φ,ψ dihedral angle values)之間。 2. 能量最小化方法,這些轉動子組與局部的環境無關連。 29 29
,這種顯著的相關連是在側鏈二面角機率(χ1,χ2 dihedral angle. probabilities)和主鏈二面角估計值(φ,ψ dihedral angle values)之間。 2. 能量最小化方法,這些轉動子組與局部的環境無關連。")
30
Errors in Homology Modeling
- target --- template a) Side chain packing b)Distortions and shifts c) No template True structure Template Model 30 30
 Side chain packing b)Distortions and shifts c) No template. True structure. Template. Model")
31
Errors in Homology Modeling
d) Misalignments e) Incorrect template True structure Template Model 31 (Marti-Renom et al., 2000) 31
 Misalignments e) Incorrect template. True structure. Template. Model. 31. (Marti-Renom et al., 2000) 31.")
32
PROCHECK, Verify3D, Prosa, Anolea, Bala …
Verify3D analyzes the compatibility of an atomic model (3D) with its own amino acid sequence (1D). 32 32
 with its own amino acid sequence (1D)")
33
PROCHECK http://www.biochem.ucl.ac.uk/~roman/ procheck/procheck.html β
α procheck/procheck.html 33 33

34
Verify3D Verify3D analyzes the compatibility of an atomic model (3D) with its own amino acid sequence (1D). We show that an effective test of the accuracy of a 3D protein model is a comparison of the model to its own amino-acid sequence, using a 3D profile, computed from the atomic coordinates of the structure 3D profiles of correct protein structures match their own sequences with high scores. Verify3D: The Verify3D (Eisenberg et al.) method assess protein structures using three-dimensional profiles. This program analyzes the compatibilty of an atomic model (3D) with its own amino acid sequence (1D). Each residue is assigned a structural class based on its location and environment (alpha, beta, loop, polar, apolar etc). Then a database generated from good structures is used to obtain a score for each of the 20 amino acids in this structural class. The vertical axis in the plot represents the average 3D-1D profile score for each residues in a 21-residue sliding window. The scores ranges from -1 (bad score) to +1 (good score). Luethy et al., 1992 34 34
 method assess protein structures using three-dimensional profiles. This program analyzes the compatibilty of an atomic model (3D) with its own amino acid sequence (1D). Each residue is assigned a structural class based on its location and environment (alpha, beta, loop, polar, apolar etc). Then a database generated from good structures is used to obtain a score for each of the 20 amino acids in this structural class. The vertical axis in the plot represents the average 3D-1D profile score for each residues in a 21-residue sliding window. The scores ranges from -1 (bad score) to +1 (good score). Luethy et al.,")
35
ProQ Server ProQ is a neural network-based predictor
– Structural features quality of a protein model. Correct Good Very good LGscore > LGscore > LGscore > 5 MaxSub > MaxSub > MaxSub > 0.8 ProQ is optimized to find – correct models… – …NOT (necessarily) native structures. Arne Elofssons group: 35 35
 native structures. Arne Elofssons group:")
36
Modeling accuracy (Marti-Renom et al., 2000) 36
1. 用homology modeling預測的成功與否,與sequence identity有很大的關係。 2. 這是sequence identity 和預測成功率的關係圖。 3. 說明○及● 4. 由圖可知,當sequence identity越低時,template-target difference及alignment error都會相對的增加。 36 (Marti-Renom et al., 2000) 36
 36.")
37
Utility of Structural Information
結果有好有壞,不同Level有不同的運用 Docking 的研究 37 37

38
38

39
39

40
(PS)2: protein structure prediction server
原理、流程,還有如何用該工具去預測三級結構 40 40

41
Consensus strategy The idea of consensus analysis is to gather predictions from a set of different methods. The performance of consensus methods is significantly higher than for individual methods. 3d-shotgun (Fischer D., 2003) 3d-jury (Ginalski K et al., 2003) Pmodeller (Bjorn W et al., 2003) 41
 3d-jury (Ginalski K et al., 2003) Pmodeller (Bjorn W et al., 2003) 41.")
42
Structure prediction by homology modeling
Step 1 Step 2 Step 3 Step 4 42 42

43
Overview of the (PS)2 method
1. 先簡單的講一下我們所使用的方法,等一下會對網頁做詳細的介紹 2. 目前Automatics 的方法,改變其中任何一個step 3. consensus Figure 1. Overview of the protein structure prediction server, (PS)2. 43 43
")
44
Alignment method 4, 2, 3 44 44

45
45 45
46
CASP3 servers registered:
1. 3D-PSSM (Sternberg) 2. Karplus 3. frsvr (Fischer) 4. pscan (Eloffson) 5. BASIC (Godzik) 6. GenTHREADER 7. Valentina di Francesco 8. TOPITS (Rost) 9. Bork 46
 2. Karplus 3. frsvr (Fischer) 4. pscan (Eloffson) 5. BASIC (Godzik) 6. GenTHREADER 7. Valentina di Francesco 8. TOPITS (Rost) 9. Bork. 46.")
47
CASP8 servers registered:
47

48
Model Evaluation Performance evaluation
Comparing the 47 CM targets to evaluate the performance with the other groups in CASP6. GDT_TS Score N is the total number residues of the target (native structure) GDTd is the number of aligned residues whose Cα-atom distance between the target and predicted model is less than d d is 1, 2, 4, or 8 Å. 48 48
 GDTd is the number of aligned residues whose Cα-atom distance between the target and predicted model is less than d. d is 1, 2, 4, or 8 Å")
49
Figure 3. Comparison (PS)2 with PSI-BLAST, IMPALA, and T-Coffee of the
prediction accuracies (global / local GDT_TS scores) on target T0264. 49 49
 on target T")
50
Top2 = 21 Figure 4. Comparison of (PS)2 models with all automated servers in CASP6. 50 50
2 models with all automated servers in CASP")
51
Cases Table 1. Compare with the other groups in CASP6
RBTA ESYP 3DJR MGTH 3DJS PROS PMO5 PRCM PCO5 PCOB Average GDT_TS 65.89 64.92 63.14 62.54 61.27 61.08 58.11 57.93 57.62 56.37 37.57 Cases T0269, Template 1prxA (PS)2 model, GDT_TS: 85.76 T0269, Template 1qq2A ESYP model, GDT_TS: 78.48 51 51
2 model, GDT_TS: T0269, Template 1qq2A ESYP model, GDT_TS:")
52
52 52

53
53 53

54
54 54

Similar presentations


![Structure Prediction. Tertiary protein structure: protein folding Three main approaches: [1] experimental determination (X-ray crystallography, NMR) [2]](/15/4859888/big_thumb.jpg "Structure Prediction. Tertiary protein structure: protein folding Three main approaches: [1] experimental determination (X-ray crystallography, NMR) [2]>")
, Tasmin Tamanna Haque (0905065) Department of Computer Science.>")


>")