Download presentation
Presentation is loading. Please wait.

2
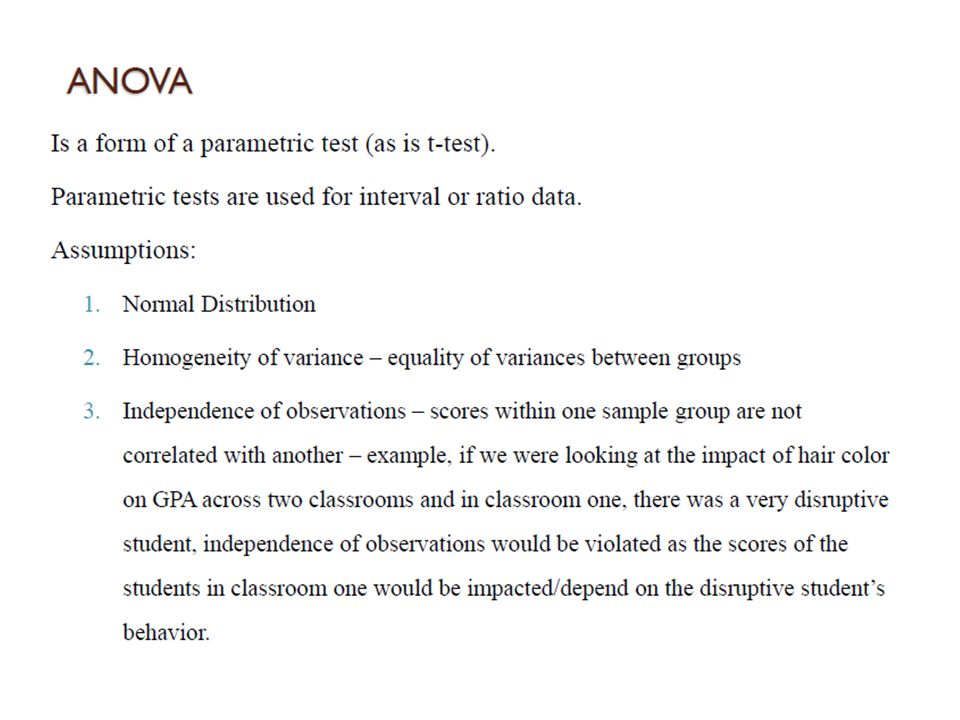
t Test Assumptions: Paired/dependent/matched Samples:
two matched or paired samples data from populations are assumed to approximate a normal distribution Variance for both samples are approximately equal Observations must be independent of each other outliers Max value 75th percentile Median 25th percentile Min value

3
One-tailed vs. Two-tailed test of significance.
With a two-tailed test of significance (at the .05 level), the alpha is split so that both directions can be covered. With a one-tailed test of significance the alpha is not split and is applied to one direction – with a one-tailed test you are testing for significance in one direction and disregarding the possibility of significance in the other direction. The one-tailed test is more likely (more powerful) in finding significance.
, the alpha is split so that both directions can be covered. With a one-tailed test of significance the alpha is not split and is applied to one direction – with a one-tailed test you are testing for significance in one direction and disregarding the possibility of significance in the other direction. The one-tailed test is more likely (more powerful) in finding significance.")
8
Group A – McDonald’s Coffee
Within Group Variance Sampling Error Variance Mean

9
Group B – Tim Horton’s Coffee
Within Group Variance Sampling Error Variance Mean

10
Group A – McDonald’s Coffee
Group B – Tim Horton’s Coffee Mean Mean

11
Group B – Tim Horton’s Coffee
Group A – McDonald’s Coffee Mean Mean Between Group Variance

17
http://www. youtube. com/watch

Similar presentations


: the two.>")


 > (.05) Retain H 0 : Equal Variances Assumed, Homogeneity of Variance Assumption is met.>")
2000 South-Western College Publishing.>")


 Hypothesis Testing with Sample.>")
