Download presentation
Presentation is loading. Please wait.

1
STUDY DESIGN

2
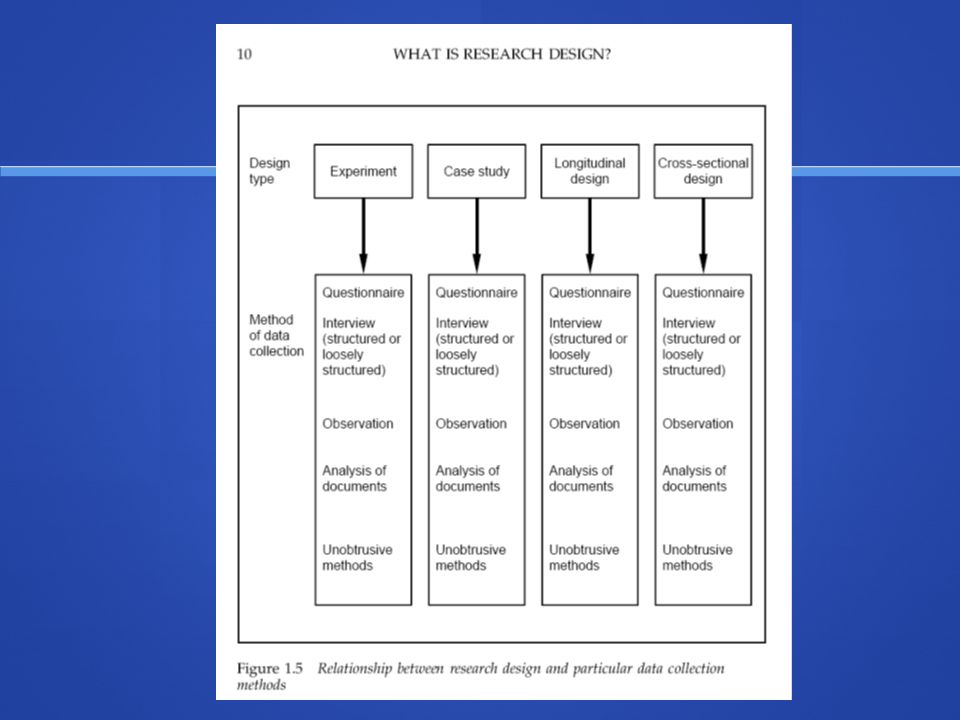
Main Tasks of Study Design Specifying what you want to find out: this involves explaining the concepts you are interested in and how they will be measured (explication and meaning analysis). Specifying what you want to find out: this involves explaining the concepts you are interested in and how they will be measured (explication and meaning analysis). Determining the best way to do it: this involves determining whom or what you will explore, describe, or explain (unit of analysis); what time dimension is appropriate for your observations; and how you are going to do it (method). Determining the best way to do it: this involves determining whom or what you will explore, describe, or explain (unit of analysis); what time dimension is appropriate for your observations; and how you are going to do it (method).
. Determining the best way to do it: this involves determining whom or what you will explore, describe, or explain (unit of analysis); what time dimension is appropriate for your observations; and how you are going to do it (method). Determining the best way to do it: this involves determining whom or what you will explore, describe, or explain (unit of analysis); what time dimension is appropriate for your observations; and how you are going to do it (method)..")
3
Design Depends on Goals What is the purpose of the research? What is the purpose of the research? What shall we observe, among whom, for what purpose, and in what time frame? What shall we observe, among whom, for what purpose, and in what time frame? Exploration Exploration Often where inquiry begins Often where inquiry begins Informal methods, feasibility testing Informal methods, feasibility testing Description Description Detail the features of elements under review Detail the features of elements under review E.g., Malaysian Census E.g., Malaysian Census Explanation Explanation Usually the aim of social scientists Usually the aim of social scientists Relating variables to account for process Relating variables to account for process

4
Unit of Observation & Analysis Unit of observation Unit of observation What we look at to make observation What we look at to make observation E.g., People in a survey, articles in content analysis E.g., People in a survey, articles in content analysis Unit of analysis Unit of analysis What we are interested in studying What we are interested in studying Usually same as unit of analysis; sometimes different: Usually same as unit of analysis; sometimes different: E.g., Are “traditional” marriages more successful? E.g., Are “traditional” marriages more successful? Unit of observation: husbands, wives Unit of observation: husbands, wives Unit of analysis: marriage type (couple) Unit of analysis: marriage type (couple)
 Unit of analysis: marriage type (couple).")
5
Types of Units of Analysis Individuals Individuals Groups Groups Organizations Organizations Social Interactions Social Interactions Social Artifacts Social Artifacts What is important is the logic of units of analysis.

6
Units of Analysis: Individuals Most common unit of analysis in social science research Most common unit of analysis in social science research Seek to explain differences between individuals and relationships among individual differences Seek to explain differences between individuals and relationships among individual differences Variables and Relationships: Variables and Relationships: E.g., Income, Age, Gender, Education E.g., Income, Age, Gender, Education E.g., Associated with differences in tolerance E.g., Associated with differences in tolerance

7
Units of Analysis: Social Groups Examples: Examples: Households, families, neighborhoods, gangs Households, families, neighborhoods, gangs Seek to explain differences between groups and relationships among those differences Seek to explain differences between groups and relationships among those differences Variables: Variables: Households: income, media use (Nielsen) Households: income, media use (Nielsen) Marriages: types, communication patterns Marriages: types, communication patterns Neighborhoods: crime rates, income stratification Neighborhoods: crime rates, income stratification
 Households: income, media use (Nielsen) Marriages: types, communication patterns Marriages: types, communication patterns Neighborhoods: crime rates, income stratification Neighborhoods: crime rates, income stratification")
8
Units of Analysis: Organizations Examples: Examples: Corporations, Universities, Governments Corporations, Universities, Governments Groups with formal organizational structures Groups with formal organizational structures Seek to explain differences between formal social organizations and the relationships among organizational differences Seek to explain differences between formal social organizations and the relationships among organizational differences Variables: Variables: E.g., Corporations: employees, benefits, productivity E.g., Corporations: employees, benefits, productivity

9
Units of Analysis: Social Interactions Examples: Examples: Kisses, Arguments, Email exchanges, discussion styles Kisses, Arguments, Email exchanges, discussion styles Social interaction are usually the product of interplay between individuals. Social interaction are usually the product of interplay between individuals. Studies seek to explain different types of social interactions (ex. discussion as unit of analysis), the types of people engaging in certain interactions (ex. Individual as the unit of analysis) Studies seek to explain different types of social interactions (ex. discussion as unit of analysis), the types of people engaging in certain interactions (ex. Individual as the unit of analysis) Variables: Variables: Number of arguments, argumentative people Number of arguments, argumentative people
, the types of people engaging in certain interactions (ex. Individual as the unit of analysis) Studies seek to explain different types of social interactions (ex. discussion as unit of analysis), the types of people engaging in certain interactions (ex. Individual as the unit of analysis) Variables: Variables: Number of arguments, argumentative people Number of arguments, argumentative people.")
10
Units of Analysis: Social Artifacts Examples: Examples: TV programs, newspaper articles, documents TV programs, newspaper articles, documents Social artifacts are any product of social beings or their behaviors. Social artifacts are any product of social beings or their behaviors. Studies seek to explain differences between social artifacts, the artifacts produced by different source, and the relationships among these factors Studies seek to explain differences between social artifacts, the artifacts produced by different source, and the relationships among these factors Variables: Variables: Level of violence, number of sources used Level of violence, number of sources used

11
Time Dimension & Research Design Time and issues of causation Time and issues of causation Static designs: Static designs: Cross-sectional study Cross-sectional study Longitudinal designs: Longitudinal designs: Trend studies Trend studies Cohort studies Cohort studies Panel studies Panel studies

13
Cross-sectional Studies Static snapshot Static snapshot Slice of population at one point in time Slice of population at one point in time E.g., An opinion poll E.g., An opinion poll Inherent limitations: Inherent limitations: Inability to capture change over time Inability to capture change over time Making causal inferences is dangerous Making causal inferences is dangerous

14
Cross-sectional studies Top Global Concerns for 2003 % who list item among top 3 personal concerns Source: Roper Reports Worldwide 2003Roper Reports Worldwide 2003 Study of 30,000 consumers age 13 to 65 in 30 countries

15
Cross-sectional studies

16
Longitudinal Designs Multiple observations across time Multiple observations across time Tracking changes across time Tracking changes across time Maybe in response to stimulus that occurs between observations Maybe in response to stimulus that occurs between observations Testing for changes resulting from some intervening factor or event Testing for changes resulting from some intervening factor or event Pretest-Posttest design in experimentation Pretest-Posttest design in experimentation

17
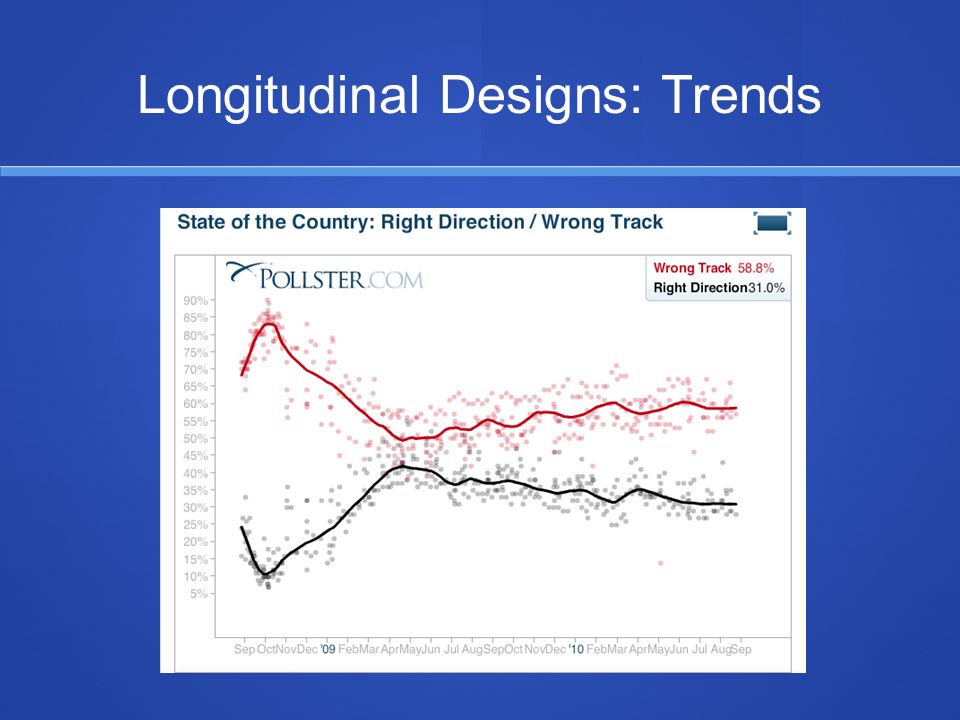
Measures change in population over time Measures change in population over time Sequential cross-sections of the population Sequential cross-sections of the population E.g., Changes over time in: E.g., Changes over time in: Public knowledge levels Public knowledge levels Voter turnout rates Voter turnout rates Presidential approval ratings Presidential approval ratings Inherent limitations: Inherent limitations: Starting point Starting point Inability to capture individual change over time Inability to capture individual change over time Longitudinal Designs: Trends

19
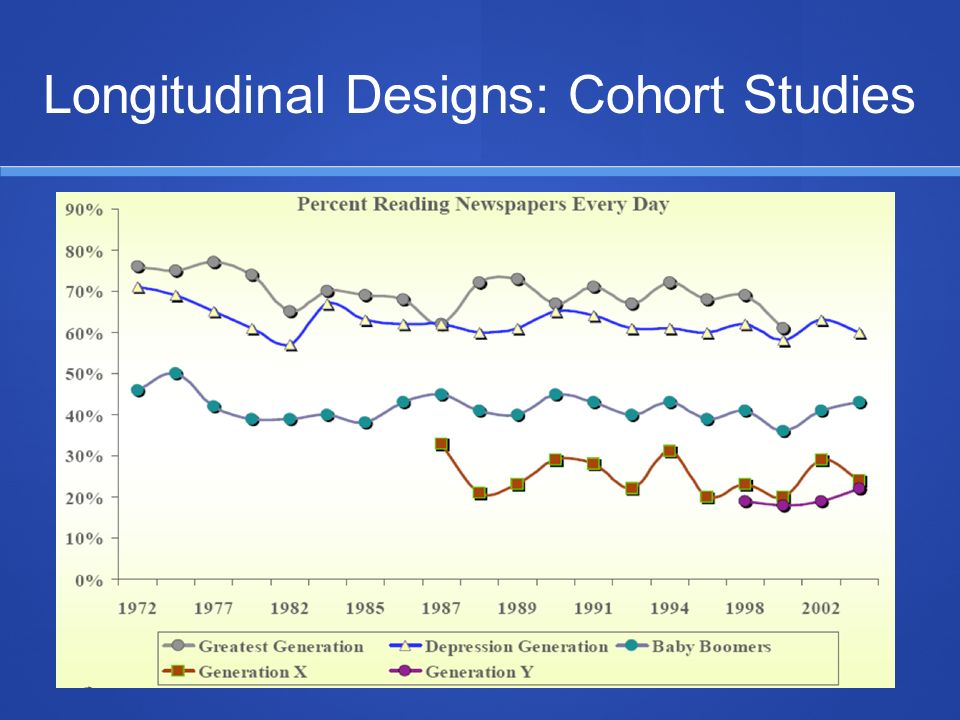
Tracking changes in a group as they age Tracking changes in a group as they age E.g., People born in 1940 sampled every 10 years E.g., People born in 1940 sampled every 10 years Measure change across the aging process Measure change across the aging process E.g., Do people become more conservative? E.g., Do people become more conservative? Cannot answer this question with a cross-sectional design because differences in age may be due to cohort or lifecycle differences. Cannot answer this question with a cross-sectional design because differences in age may be due to cohort or lifecycle differences. Longitudinal Designs: Cohort Studies

21
Goes a step further: Goes a step further: Interviewing the same people more than once Interviewing the same people more than once Captures change in individuals over time Captures change in individuals over time E.g., NES (cross-sectional and panel) E.g., NES (cross-sectional and panel) How do people react over time? How do people react over time? E.g, Public health/info campaigns E.g, Public health/info campaigns The respondent mortality problem The respondent mortality problem Are those who drop out different? Are those who drop out different? Longitudinal designs: panel studies

22
Wave 1 Feb. 1999 N= 3,348 Wave 2 June 2000 N= 1,886 Wave 3 Nov. 2000 N= 1,282 Wave 4 July 2001 N= 964 Statement: “Most people are honest” On a six point scale ranging from definitely disagree to definitely agree. Source: Life Style Study – conducted by Market Facts on behalf of DDB- Chicago and Dhavan V. Shah Longitudinal designs: panel studies

23
Longitudinal designs: comparisons Cross-sectional study 2000 21-30 31-40 41-50 51-60 61-70 1990 21-30 31-40 41-50 51-60 61-70 2000 21-30 31-40 41-50 51-60 61-70 Cohort study Trend study 1990 21-30 31-40 41-50 51-60 61-70 2000 31-40 41-50 51-60 61-70 71-80 2010 41-50 51-60 61-70 71-80 81-90 Panel study 1990 21-30 31-40 41-50 51-60 61-70 2000 31-40 41-50 51-60 61-70 71-80 2010 41-50* 51-60* 61-70* 71-80* 81-90*

24
OTHER TYPE OF STUDY DESIGN

25
Types of Study Design Descriptive Descriptive Case-Control Case-Control Cohort Cohort Experimental Experimental Quasi-experimental Quasi-experimental 25

26
26 Study Design Non- intervention Exploratory Descriptive Analytical / Comparative Case-controlCohortInterventionExperimental Quasi- experimental Study Design

27
Exploratory studies Exploratory studies is a small-scale study of relatively short duration, which is carried out when little is known about a situation or a problem. It may include description as well as comparison. 27

28
Study Design Descriptive studies Descriptive studies involves describing the characteristics of a particular situation, event or case. to answer WHAT, WHERE, WHEN and HOW 28

29
Descriptive Involves the systematic collection and presentation of data to give a clear picture of a particular situation Involves the systematic collection and presentation of data to give a clear picture of a particular situation Aims at defining “what is the problem?” and seek to explore and identify various factors associated with the problem. Aims at defining “what is the problem?” and seek to explore and identify various factors associated with the problem. 29

30
Derives: Prevalence rates Association between variables Descriptive 30

31
Advantages Relatively cheap to conduct Relatively quick to carry out Disadvantages Captures the situation at only one point in time Unable to show causal relationship 31 Descriptive

32
Study Design Comparative or analytical studies Comparative or analytical studies An analytical study attempts to establish causes or risk factors for certain problems. This is done by comparing two or more groups, some of which have or develop the problem and some of which have not. 32

33
Case-control Study design that one group which has a particular characteristic/disease (case) with another group without the characteristic/ disease (control) in order to find out what factors have contributed to that characteristic /disease Study design that one group which has a particular characteristic/disease (case) with another group without the characteristic/ disease (control) in order to find out what factors have contributed to that characteristic /disease Matched on certain variables but not on which one expects to cause the problem Matched on certain variables but not on which one expects to cause the problem Usually use historical (retrospective) data Usually use historical (retrospective) data 33
 with another group without the characteristic/ disease (control) in order to find out what factors have contributed to that characteristic /disease Study design that one group which has a particular characteristic/disease (case) with another group without the characteristic/ disease (control) in order to find out what factors have contributed to that characteristic /disease Matched on certain variables but not on which one expects to cause the problem Matched on certain variables but not on which one expects to cause the problem Usually use historical (retrospective) data Usually use historical (retrospective) data 33")
34
Advantages Relatively cheap to conduct Relatively quick to carry out Able to show causal relationship Disadvantages Dependant on the availability and quality of existing data There might be difficulty in matching the cases Selective survival might bias the comparison Unable to calculate incidence rates 34 Case-control

35
Examples: Cancer Aetiological study Hepatitis B and Hepatoma study Study of the relation between sinusitis and subsequent risk of multiple sclerosis 35 Case-control

36
Experimental Research designs "gold standard“ Research designs "gold standard“ Most “rigorous” of all research designs Most “rigorous” of all research designs Provide cause-effect inferences Provide cause-effect inferences Need: Need: Randomization Randomization Control and treatment group Control and treatment group Intervention Intervention 36

37
Experimental 37

38
Can obtain: Cause-effect relationships Evaluation of the intervention 38 Experimental

39
Advantages Useful in clinical/laboratory research Able to test cause-effect relationships Do not require large sample size Disadvantages It is an expensive study Ethical issues Difficult to conduct in a community-based research 39 Experimental

40
Experimental 40 Examples: Clinical / Drug Trial A Mental Health Experimental Study

41
Quasi-experimental “Quasi” = ‘as if’ or ‘almost’ “Quasi” = ‘as if’ or ‘almost’ Either no randomization or control group Either no randomization or control group 41 Quasi-experimental design is a form of experimental research used extensively in the social sciences and psychology

42
Advantages Able to test cause- effect relationships Useful for evaluation of intervention in the community Disadvantages It is an expensive study Ethical issues 42 Quasi-experimental

43
43 Examples: To perform an educational experiment, a class might be arbitrarily divided by alphabetical selection or by seating arrangement. The experiment proceeds in a very similar way to any other experiment A variable being compared between different groups, or over a period of time. Quasi-experimental

44
Other design 44 Systematic review Meta-analysis

45
Systematic review 45 A systematic review is a comprehensive survey of a topic that takes great care to find all relevant studies of the highest level of evidence, published and unpublished, assess each study, synthesize the findings from individual studies in an unbiased, explicit and reproducible way and present a balanced and impartial summary of the findings with due consideration of any flaws in the evidence. In this way it can be used for the evaluation of either existing or new technologies and practices.

46
Systematic review 46

47
Meta-analyses 47 Meta-analysis is a systematic, objective way to combine data from many studies, and arrive at a pooled estimate of treatment effectiveness and statistical significance. Meta-analysis can also combine data from case/control and cohort studies. The advantage to merging these data is that it increases sample size and allows for analyses that would not otherwise be possible. They should not be confused with reviews of the literature or systematic reviews.

48
48 Meta-analyses

49
49

50
50

Similar presentations


. Involves the collection and analysis of highly structured.>")


 Dr. Khalid El Tohami.>")


