Download presentation
Presentation is loading. Please wait.

1
Warm-up O Make sure to use a ruler and proper scaling for the box-plots. O This will be taken up for a grade! O Today we start the last chapter before our big test! O Start thinking about what you want to put on your index card for the test.

2
Objectives O Learn how shifting and rescaling affect the measures of center and spread. O Describe a Normal model and discuss when it is appropriate to use. O Learn how to standardize a Normal model by calculating z-scores. O Describe why standardizing the model is critical when comparing data sets.

3
I. Shifting & Rescaling Data A. Shifting data o Moves the distribution to the R or L (translation) by adding or subtracting a constant value from each data point.
 by adding or subtracting a constant value from each data point..")
4
Example 1 O A summary of what I pay my hourly workers at my company are in the table below. What happens to this summary if I decide to give everyone a $10/hr raise? PayPay + raise Min12 Q115 Med22 Mean30 Q355 Max95 IQR Sx15

5
What does shifting do to… O Measures of spread? O Measures of position including center? O Shape?

6
I. Shifting & Rescaling Data B. Rescaling data o Dilates the distribution by multiplying or dividing by a common factor.

7
Example 2 O A summary of what I pay my hourly workers at my company are in the table below. What happens to this summary if I decide to give everyone a 20% raise? PayPay + raise Min12 Q115 Med22 Mean30 Q355 Max95 IQR Sx15

8
What does rescaling do to… O Measures of spread? O Measures of position including center? O Shape?

9
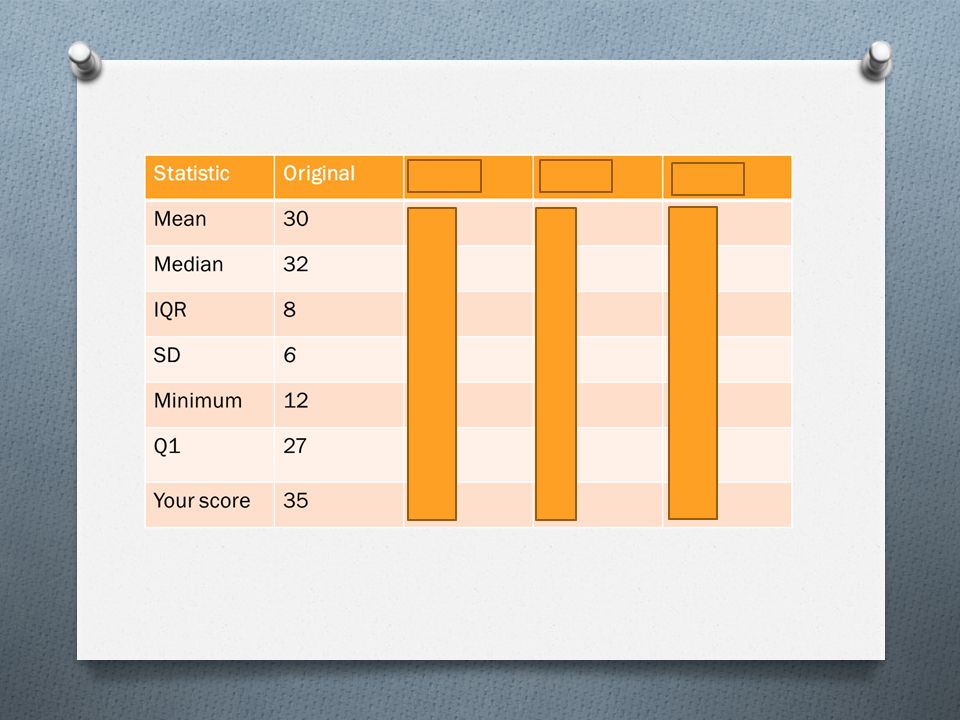
You try!! O Suppose the class took a 40 point quiz. Results show a mean score of 30, median 32, IQR 8, SD 6, min 12, and Q1 27. (Suppose YOU got a 35.) What happens to each of the statistics if….. O I decide to weight the quiz 50 points, and will add 10 points to every score. O I decide to weight the quiz as 80 points, and double each score. O I decide to count the quiz as 100 points; so the scores are doubled and 20 points are added.
 What happens to each of the statistics if….. O I decide to weight the quiz 50 points, and will add 10 points to every score. O I decide to weight the quiz as 80 points, and double each score. O I decide to count the quiz as 100 points; so the scores are doubled and 20 points are added..")
11
I. Normal Distribution A. Characteristics o Unimodal, symmetric, bell-shaped. o The mean and median are the same and located in the middle of the peak. o Are described by the mean and standard deviation N(µ, σ ) : where µ = the mean and σ = std dev
 : where µ = the mean and σ = std dev.")
12
II. Normal Distribution B. Importance o Are good descriptions for some distributions of real data. (IQ, SAT’s, characteristics in biological populations) o Are good approximations to the results of many kinds of chance outcomes. o Many statistical inferences are based on the normal curve model.
 o Are good approximations to the results of many kinds of chance outcomes. o Many statistical inferences are based on the normal curve model..")
13
II. Normal Distribution C. 68-95-99.7 RULE

14
Example 3 O If µ = 72 and σ = 4, What percent of the class scored between 68 and 76?

15
Example 3 O What percent of students failed? O What percent of students scored above an 80? O Is it likely that someone got an ‘A’ on the test?

16
III. Standardizing Normal Distribution O Has a mean of 0 and a standard deviation of 1. O To standardize data, convert each to a z-score

17
III. Standardizing Normal Distribution

18
Example 4 O The Virginia Cooperative Extension reports that the mean weight of yearling Angus steers is 1152 pounds. Suppose the weights of all such animals can be described by a Normal model with a standard deviation of 84 pounds. O a) How many standard deviations from the mean would a steer weighing 1000 pounds be? O b) Which would be more unusual, a steer weighing 1000 pounds, or one weighing 1250 pounds?
 How many standard deviations from the mean would a steer weighing 1000 pounds be. O b) Which would be more unusual, a steer weighing 1000 pounds, or one weighing 1250 pounds .")
Similar presentations


 Variable: Characteristic of an individual. It can take.>")


Which set has the largest standard deviation? The smallest? a. 0 10 20 30 40 b. 0 0 20 40 40 c. 0 19 20 21 40 2)Without calculating,>")


