Download presentation
Presentation is loading. Please wait.

4
You can calculate: Central tendency Variability You could graph the data

5
You can calculate: Central tendency Variability You could graph the data

6
Bivariate Distribution

7
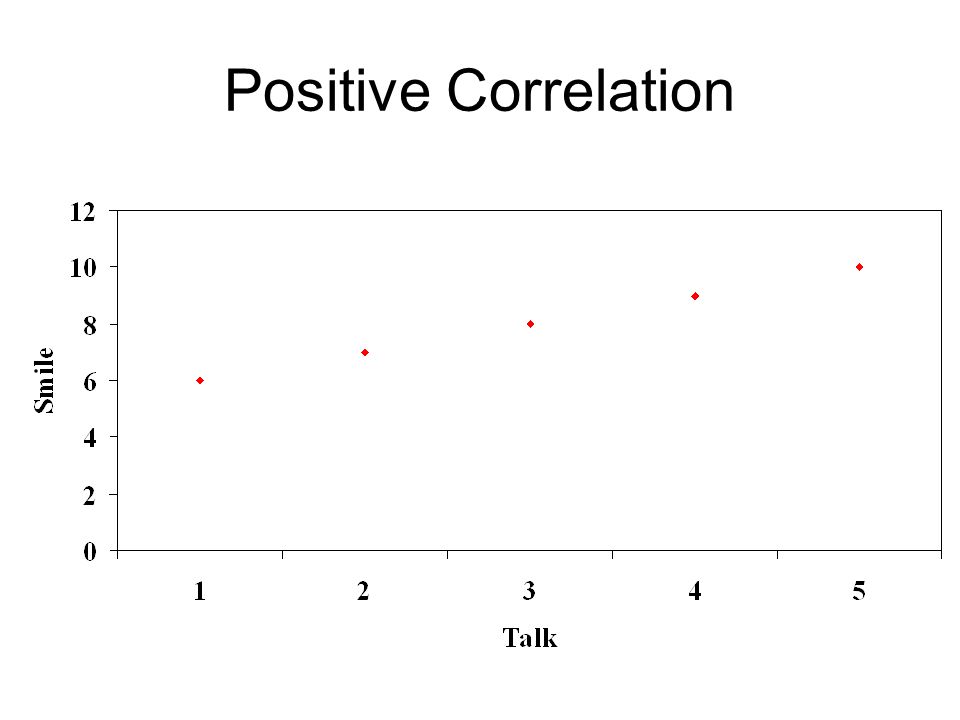
Positive Correlation

9
Regression Line

10
Correlation r = 1.00

11
Regression Line..... r =.64

12
Regression Line.... r =.64.

14
Negative Correlation

15
r = - 1.00

16
Negative Correlation..... r = -.85

18
Zero Correlation

19
..... r =.00

20
Correlation Coefficient The sign of a correlation (+ or -) only tells you the direction of the relationship The value of the correlation only tells you about the size of the relationship (i.e., how close the scores are to the regression line)
 only tells you the direction of the relationship The value of the correlation only tells you about the size of the relationship (i.e., how close the scores are to the regression line)")
21
Which is a bigger effect? r =.40 or r = -.40 How are they different?

22
Interpreting an r value What is a “big r” Rule of thumb: Smallr =.10 Mediumr =.30 Larger =.50

23
Practice Do you think the following variables are positively, negatively or uncorrelated to each other? Alcohol consumption & Driving skills Miles of running a day & speed in a foot race Height & GPA Forearm length & foot length Test #1 score and Test#2 score

24
Practice –#6.8 –#6.5 1) Draw a scatter plot 2) Estimate the correlation
 Draw a scatter plot 2) Estimate the correlation")
25
6.8 A) -.60 B) -.95 C).50 D).25
 -.60 B) -.95 C).50 D).25")
26
6.5 r =.51

28
.....

29
Statistics Needed Need to find the best place to draw the regression line on a scatter plot Need to quantify the cluster of scores around this regression line (i.e., the correlation coefficient)
")
30
Correlation Coefficient A correlation coefficient provides a quantitative way to express the degree of relationship between two variables There are 3 different formulas presented in the book Z-score formula is a good way to see “what's going on”

31
Blanched Formula XY = product of each X value multiplied by its paired Y value X = mean of variable X Y = mean of variable Y S x = standard deviation of variable X S y = standard deviation of variable Y N = number of pairs of observations r =

33
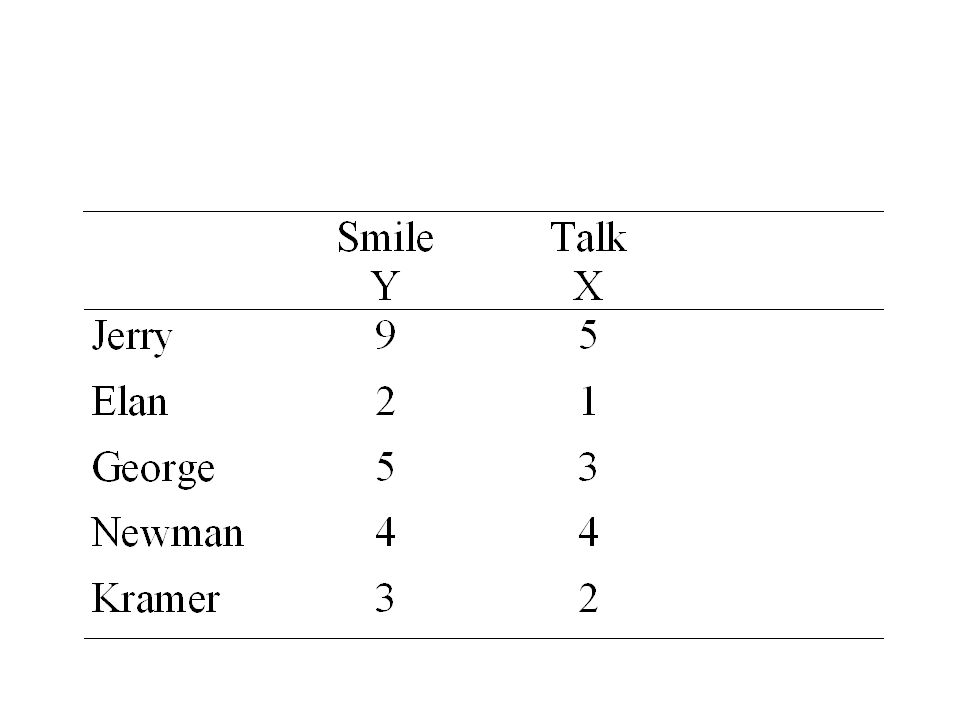
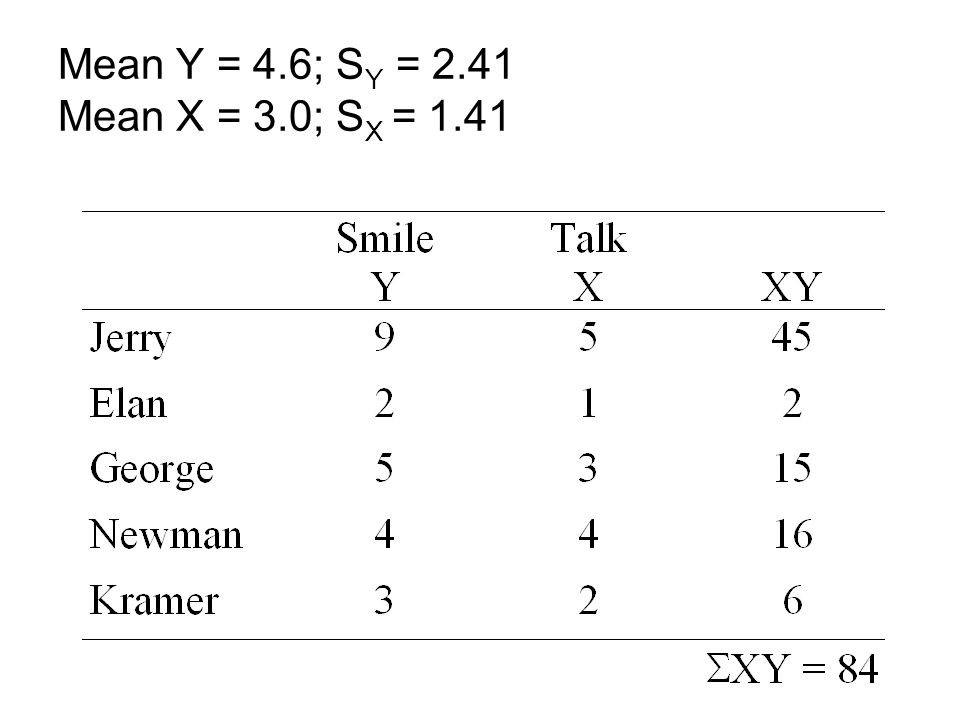
Mean Y = 4.6; S Y = 2.41 Mean X = 3.0; S X = 1.41

35
Blanched Formula XY = 84 X = 3.0 Y = 4.6 S x = 1.41 S y = 2.41 N = 5 r =

36
Blanched Formula r = 84 XY = 84 X = 3.0 Y = 4.6 S x = 1.41 S y = 2.41 N = 5

37
Blanched Formula r = 84 4.63.0 XY = 84 X = 3.0 Y = 4.6 S x = 1.41 S y = 2.41 N = 5

38
Blanched Formula r = 84 1.41 2.41 5 XY = 84 X = 3.0 Y = 4.6 S x = 1.41 S y = 2.41 N = 5 4.63.0

39
Blanched Formula r = 84 4.6 3.0 1.41 2.41 5 16.813.8 XY = 84 X = 3.0 Y = 4.6 S x = 1.41 S y = 2.41 N = 5

40
Blanched Formula r = 84 4.6 3.0 2.41 1.41 5 16.813.8 3.40 3.00.88 XY = 84 X = 3.0 Y = 4.6 S x = 1.41 S y = 2.41 N = 5

43
Practice What is the relationship between aggression and happiness?

44
Mean aggression = 14.50; S aggression = 4.43 Mean happiness = 6.00; S happiness = 2.16

46
Blanched Formula XY = 326 X = 6.0 Y = 14.50 S x = 2.16 S y = 4.43 N = 4 r =

47
Blanched Formula -.57 = 326 2.16 4.43 4 14.56.0 XY = 326 X = 6.0 Y = 14.50 S x = 2.16 S y = 4.43 N = 4

Similar presentations


 n mean interpreted.>")

 of the following.>")


 x y A scatter plot is a graph of the ordered pairs (x, y)>")


