Download presentation
Presentation is loading. Please wait.

1
Changes in carbon cycling by Brazilian rain forest: effects of soil moisture reduction on soil, leaves and canopy Patrick Meir, AC Lola da Costa, S Almeida R Fisher, R Lobo do Vale, R Medeiros, E Sotta, R Costa, J Costa, C Carvalho, MRL Ruivo, E Veldkamp, M Chaves, M Williams, Y Malhi, J Grace Museu Paraense Emílio Goeldi, Universidade Federal de Pará, Embrapa, Universidade Federal de Viçosa, University of Göttingen, ISA Lisbon, University of Edinburgh

2
Carboncycle-Ecobioma LBA: Carbon and water cycle studies at Caxiuanã National Forest, Pará Museu Paraense Emílio Goeldi, Universidade Federal de Pará, Universidade Federal de Viçosa University of Göttingen ISA, Lisbon University of Edinburgh

3
Approach: Weather + canopy flux measurements Component-scale measurements Experimental drought: separating soil moisture effect Tower Soil shafts 12341234 5 TreatmentControl ~ 2 km Eddy covariance Experimental 1 ha plots A drought experiment to extend understanding of forest response to soil moisture deficit

4
Experimental drought: exclusion of throughfall

5
Soil respiration Soil moisture profiles Leaf gas exchange Sap flow Leaf water potential, hydraulic conductivity

6
Some results

7
Soil moisture Soil drought up to 200 mm in first 3 m of soil column (~30%) Exclusion started
 Exclusion started")
8
Significant uncertainty in response by Amazon rain forest to drought Extent Mechanisms Timescales

9
Soil respiration: response, timescale, constraints? Leaf physiology: biochemistry or water relations? Sap flux: PPFD response, difference in stand-scale activity? Canopy litter production: total and reproductive.

10
Soil respiration 1: time series variation Reduced CO 2 efflux in droughted treatment max ~30-40%; average 20% CO 2 efflux mol m -2 s -1

11
Soil respiration 2: environmental response Temperature non-significant (r 2 0.1) at 14 day timescale Moisture highly-significant (r 2 =0.42, P<0.0001), combined data [Soil matric potential to be determined]
![Soil respiration 2: environmental response Temperature non-significant (r 2 0.1) at 14 day timescale Moisture highly-significant (r 2 =0.42, P<0.0001), combined data [Soil matric potential to be determined]](http://images.slideplayer.com/28/9296589/slides/slide_11.jpg "Soil respiration 2: environmental response Temperature non-significant (r 2 0.1) at 14 day timescale Moisture highly-significant (r 2 =0.42, P<0.0001), combined data [Soil matric potential to be determined]")
12
Soil respiration 3: physical constraints CO 2 concentration (volume fraction) …biotic driving mechanisms?
 …biotic driving mechanisms")
13
Leaf gas exchange 1: biochemical parameters? No significant response in V cmax to drought stress (seasonal, experimental) Drought Control V cmax changes seasonally in temperate forests (e.g., Wilson et al. 2000) Can we detect changes in tropical rain forest?
 Drought Control V cmax changes seasonally in temperate forests (e.g., Wilson et al. 2000) Can we detect changes in tropical rain forest .")
14
Leaf gas exchange 2: stomatal conductance Seasonal, interannual, experimental If V cmax does not change significantly, does g s ? DroughtControl

15
Nov01-May02 May02-Nov02 Nov01_Nov02 Dry-Wet Wet-Dry Dry01-Dry02 Sap flux 1: response to radiation Exclusion Jan02 n=12 Change in the gradient of sap flux-PPFD response (seasons + drought treatment)
")
16
Sap flux 2: scaled to plot

17
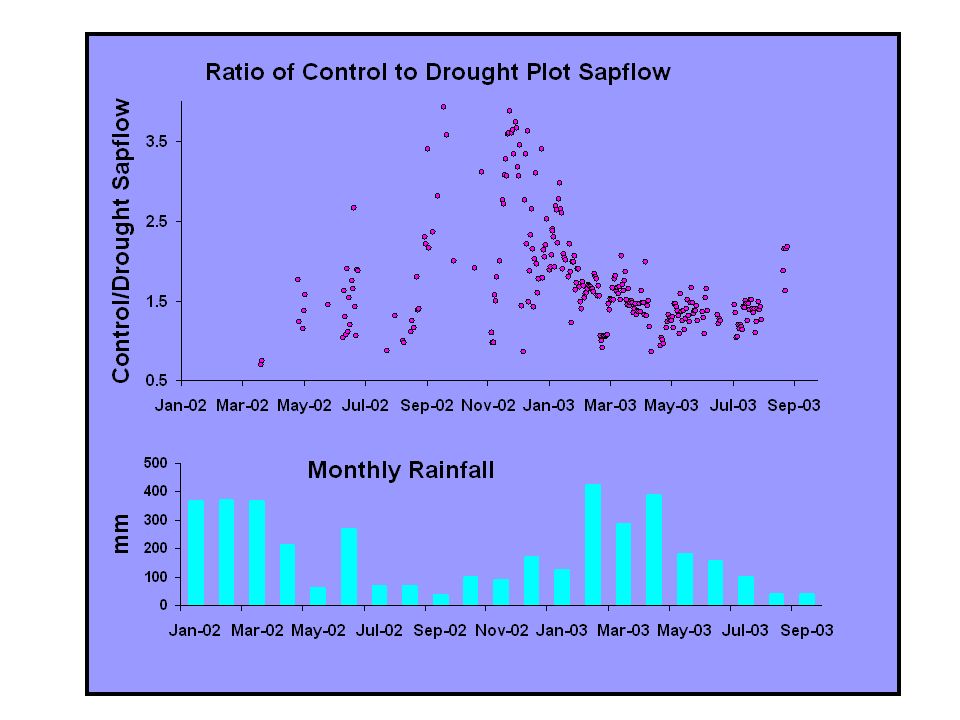
Sap flux 3: ratio of ‘control to drought’ Ratio in sapflow Monthly rainfall (i) Large effect (ii) High sensitivity
 Large effect (ii) High sensitivity")
18
Canopy production 1 : total litterfall Total litterfall reduced by ~30% in 2002 (drought)
")
19
Canopy production 2: reproductive structures Very low fruit & flower fall

20
1.Reproduction ‘switched off’ (?) within 1 cycle. 2.Soil respiration reduced (~20%). 3.Leaf phys. = reduction in g s, NOT biochemical params. 4.Consistent changes in sap flux/PPFD response. 5.Up-scaled sap flux suggests: (i) Increased and large sensitivity to rainfall events. (ii) Large reduction in production? Summary
 Increased and large sensitivity to rainfall events. (ii) Large reduction in production. Summary.")
22
Initial comparisons (1-2 years) Similarity in surface soil moisture response Reductions in max. photosynthesis No reduction in soil respiration (no drought effect) Year 1 Year 2 Nepstad et al 2002 Soil CO 2 emissions - Tapajós
 Year 1 Year 2 Nepstad et al 2002 Soil CO 2 emissions - Tapajós.")
23
Up-scaled fluxes agree with whole canopy data Tree size – sap flow relationship uniform among species (n=59, P<0.01)
")
25
IPCC 2001 Large scale perturbations in atmosphere affect the rate of increase in global CO 2 concentrations, e.g., El Niño

26
Pg C/year Model Bousquet et al. 2000 Inversion studies: resolving the tropical land flux El Niño: correlation with flux to the atmosphere More recent studies confirm for tropics and S.America Data-model inconsistencies Inversion result

27
Net carbon balance (Pg C y -1 ) Prentice and Lloyd 1998, Tian et al. 2000 Modelling of Amazon C balance Year With C-cycle Without C-cycle Modelling of global atmosphere coupled with carbon-cycle model ? Cox et al., 2000

28
Central Eastern South- western WET DRY Eastern South-western Central Solar time Direct measurement by eddy covariance Monthly NEE & rainfall Kruijt et al. (unpublished)
.")
29
Legend 1. Weather 2. Leaf physiology, canopy structure 3. Inventory, growth, sap flow 4. Soil moisture, gas exchange 5. Root density, soil moisture, soil properties Tower Soil shafts 12341234 5 A large-scale rainfall exclusion experiment to ‘simulate’ El Niño

30
Sap flux 2: scaling up Fitting a multilayer physiological model, SPA

31
Integrating measures and model outputs: initial results Stem growth (census > 10 cm dbh): C gain in droughted forest relative to control = ~ 1 t C ha -1 yr -1 (rate of gain = 30% of control). Trees > 60 cm dbh affected most Control Drought Model (SPA): 1) Modelled and measured (porometry) leaf-level g s match 2) GPP is up to 15% less in droughted than in control. Change in below-ground C allocation ? C gain Apr-Nov (t ha -1 )
: 1) Modelled and measured (porometry) leaf-level g s match 2) GPP is up to 15% less in droughted than in control. Change in below-ground C allocation . C gain Apr-Nov (t ha -1 ).")
Similar presentations


>")

, Nobre, A D 2), Grace, J 3),>")


 in tree rings: principles and potential J. Renée Brooks Western Ecology Division,>")


